Together with evapotranspiration and condensation, precipitation is a key process in the global water cycle. Precipitation develops when droplets form in the atmosphere at below dewpoint temperatures and accumulate to be too heavy to remain suspended in mid-air.
Along with temperature, precipitation is one of the most commonly recorded meteorological quantities, with records dating back several centuries. The longest continuous observational record of precipitation in Canada dates back to 1840 when the Toronto Meteorological Observatory started operating a station at Fort York.
Precipitation is physically described as linear depth, usually recorded in millimetres (volume/area), kg m-2 (mass/area) (WMO, https://library.wmo.int/doc_num.php? explnum_id=3152). However, to address precipitation intensity, the linear depth is put in relation to time units to describe the flux, usually in millimetres per hour or per day (mm h-1, mm d-1, kg m-2 s-1). An equivalent amount of precipitation can be denoted in litres per square metre (l m-2). Snow depth is commonly measured in centimetres and can be translated to its Snow Water Equivalent (SWE) with the same units as liquid precipitation.
Precipitation develops in three main types: convective, stratiform and orographic rainfall, each involving a vertical upward motion of air. This uplift invokes cooling of the air, leading to condensation forming clouds and eventually droplets falling from the cloud. While convective and orographic rainfall can be spatially rather confined, stratiform precipitation may cover very large areas extending over hundreds of kilometres. The duration of precipitation events varies from minutes to days, where convective events may be short in duration and high in intensity, while stratiform and orographic events tend to last longer, with usually lower intensities. Orography usually plays a major role in the seasonal and spatial distribution of precipitation with upwind slope locations receiving abundant precipitation and lee sides remaining substantially dryer. The large variation of precipitation in time and space as well as the specifics of measuring it contributes to much larger uncertainties and errors in precipitation estimates when compared to temperature or other climate variables.
Climatological annual mean precipitation over Canada is shown in Figure 3.2. Coastal regions, in particular along the western cordillera in the West receive consistently larger amounts of precipitation than the central plains and the Great Lakes water bodies bring somewhat higher precipitation amounts to their Eastern surroundings. In the Canadian North, however, the precipitation along coasts is much less pronounced and a northward gradient towards much dryer conditions prevails, with less than 250 mm per year over the Canadian Arctic Archipelago. Generally, the winter season in Canada tends to provide lower amounts of precipitation than the summer season, to varying degrees and annual amplitudes of different magnitudes across the continent.
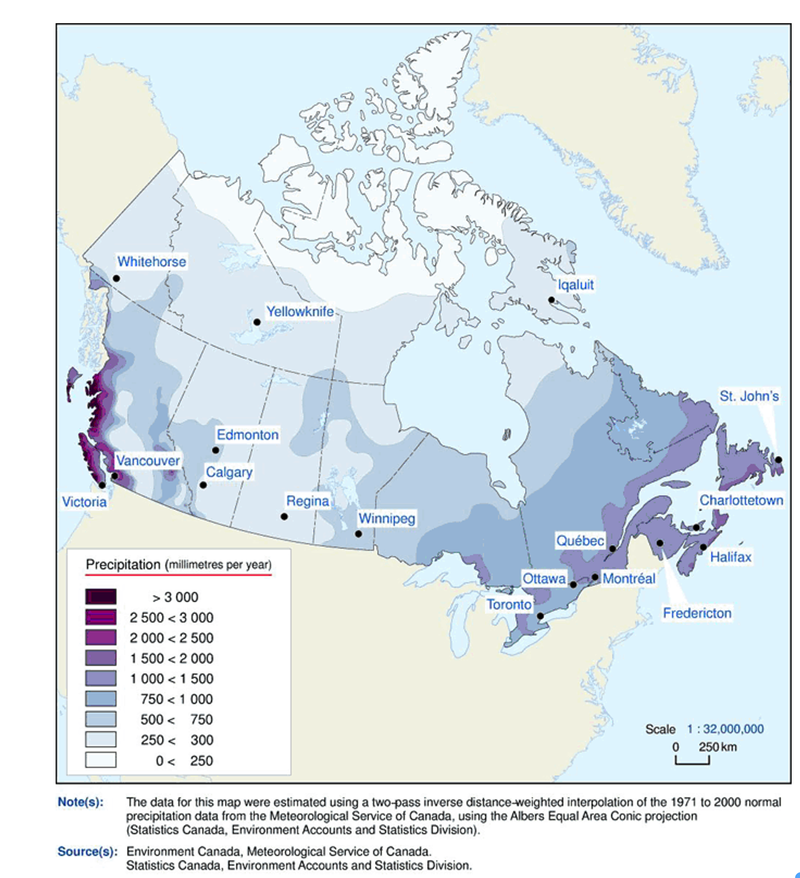
Figure 3.2 Climatological annual mean precipitation (1971-2000) over Canada. [Source: https://www150.statcan.gc.ca/n1/pub/16-201-x/2006000/4177438-eng.htm ]
The delivery of water through precipitation plays an important role for fauna and flora and the ecosystems that sustain them. Humans depend on precipitation for growing crops and livestock and exploit the water bodies fed by rainfall and snow melt for drinking water, industry, transport, and recreational activities. Water management is a crucial part of human activity and precipitation as its key driver is closely monitored. Both too much precipitation leading to floods as well as persistent periods without precipitation can cause critical conditions and even lead to catastrophic impacts, with flooding and droughts being some of the costliest natural disasters. Same of the most used precipitation climate indices are presented in Table 3.4.
| Index | Precipitation variable needed for computation | Definition | Applications |
|---|---|---|---|
| Annual, seasonal and monthly averages and variations of precipitation | Daily precipitation | The average and standard deviation of annual, seasonal or monthly mean precipitation.The average and standard deviation of annual, seasonal or monthly mean precipitation. | General description of a location’s or region's climate and its variation across seasons and the annual cycle. |
| Total precipitation (PRCPTOT) | Daily precipitation | The PRCPTOT index is defined by the total amount of precipitation (rain and snow combined) that falls within the selected time period. | Precipitation significantly impacts water availability, agricultural practices, electricity generation and wildfire suppression. This indicator provides information about overall water availability. |
| Maximum 1-Day Total Precipitation (RX1day) | Daily precipitation | The RX1day index describes the largest amount of precipitation (rain and snow combined) that falls within a single 24-hour day for the selected time period. This index is commonly referred to as the wettest day of the year. | Very high 1-day precipitation totals could be the result of intense, but short-lived precipitation events such as thunderstorms, or may be due to precipitation occurring steadily over the course of the day. Short duration, high intensity precipitation events may lead to flash flooding, particularly in urban areas where storm drains may be overwhelmed. Heavy snowfall events can cause damage to buildings and disrupt transportation services. |
| Maximum 5-Day Precipitation (RX5days) | Daily precipitation | The RX5days index describes the largest amount of precipitation (rain and snow combined) to fall over 5 consecutive days for the selected time period. | High precipitation totals can cause flooding in urban areas, damage to crops and roads, and erode top soil. Heavy snowfall events can cause damage to buildings and disrupt transportation services. |
| Wet Days > NN mm | Daily precipitation | Wet Days > NN mm index describes the number of days where more than NN mm of precipitation (rain and snow combined) falls in a given time period (annual, seasonal). Common thresholds for NN mm are 1 mm, 10 mm and 20 mm, but other values may be used. | Adequate precipitation is crucial to water availability, agriculture, electricity generation and wildfire suppression. |
| Amount of daily precipitation above the 95th or 99th percentile | Daily precipitation | The amount of daily precipitation above the 95th (99th) percentile is the annual total precipitation falling during the 5% (1%) heaviest precipitation events. | These indicators describe strong and extreme precipitation events that may involve flooding, strong erosion and can affect and damage infrastructure. |
| Simple precipitation intensity index (SDII) | Daily precipitation | The SDII index is defined as the ratio of annual or seasonal total precipitation to the number of days during the year or season when precipitation occurred. Precipitation days are days where precipitation ≥ 1 mm. | This indicator provides information about the average intensity of precipitation events. |
| Maximum Number of Consecutive Dry Days (CDD) | Daily precipitation | The CDD index describes the longest spell of days where less than 1 mm of precipitation falls daily. | Periods of dry weather can impact agriculture, energy demands and water availability. Drought conditions may result when dry periods are long-lasting. |
Table 3.5 presents high-level information on the retained observation-based historical datasets, for total precipitation. For each dataset, a link to summaries describing the metadata is provided.
| name | source | data type | spatial domain | spatial resolution | temporal coverage | time step | data format | |
|---|---|---|---|---|---|---|---|---|
| MSC Observations | MSC/ECCC | Station data | Canada | Point data | Variable (1940 to present) | Hourly; Daily; Monthly | CSV; GeoJSON | details |
| MSC Climate Normals | MSC/ECCC | Station data | Canada | Point data | 1941-1970; 1951-1980; 1961-1990; 1971-2000; 1981-2010. | Climatological means | CSV; GeoJSON | details |
| MSC Daily Climate Records (LTCE, Long Term Climate Extremes) | MSC/ECCC | Station data | Canada | Point data | Variable | Records for each day of the year | CSV; GeoJSON | details |
| AHCCD | CRD/ECCC | Station data | Canada | Point data | Variable (1950 to present) | Daily; Monthly; Seasonal; Annual | ASCII; CSV; GeoJSON | details |
| Hydro-Québec Station data | Hydro-Québec | Station data | Northern Québec at hydroelectric stations | Point Data | Variable (1990 to present) | Variable ( sub-daily to daily) | None | details |
| SCDNA | University of Saskatchewan | Station data and reanalyses blend | North America | Point data | 1979-2018 | Daily | NetCDF | details |
| CANGRD | CRD/ECCC | Gridded observations | Canada | 50 km x 50 km | 1948 - 2017 (anomalies) | Monthly; Seasonal; Annual | CSV; GeoJSON | details |
| ANUSPLIN | CFS/NRCan | Gridded observations | Canada and North America | (10 km x 10 km) and (2 km x 2 km) | 1950 - 2017 | Daily; Pentad; Monthly; Climatological means | ASCII; NetCDF | details |
| WorldClim2 | World Conservation Monitoring Centre/UNEP | Gridded observations | Global (land only) | 10 arc minutes (~340 km);5 arc minutes;2.5 arc minutes; 30 arc seconds (1 km) | 1970-2000 | Monthly | GeoTIFF | details |
| PNWNAMET | PCIC | Gridded observations | North-western North America | 3.75 arc minutes (~6 km) | 1945-2012 | Daily | ASCII; NetCDF | details |
| Met1km | NRCan | Blend of gridded products | Canada | 1 km x 1 km | 1901–2017 | Daily | None | details |
| GPCC | WMO | Gridded observations | Global | 0.5° x 0.5°;1° x 1°;2.5° x2.5° | 1891-2016 | Daily; Monthly; Climatological means | Binary; NetCDF | details |
| CRU TS Version 4 | CRU/University of East Anglia | Gridded observations | Global | 0.5 x 0.5 | 1901-2015 | Monthly | ASCII; NetCDF | details |
| ERA5 | ECMWF | Global atmospheric reanalysis | Global | 0.25° x 0.25° | 1950 to present | Hourly; Daily; Monthly | GRIB; NetCDF | details |
| CFSR | NCEP | Global atmospheric reanalysis | Global | 0.5° x 0.5° | 1979-2017 | Sub-daily; Monthly | GRIB | details |
| MERRA-2 | NASA | Global atmospheric reanalysis | Global | ½° latitude x ⅝° longitude | 1980 to present | Hourly; Daily; Monthly | NetCDF | details |
| JRA-55 | JMA | Global atmospheric reanalysis | Global | 0.6258ᵒ x 0.6258ᵒ | 1957-2021 | 3h; 6h; Daily; Monthly | NetCDF | details |
| ASRv2 | Byrd Polar Research Center/The Ohio State University; UCAR/NCAR | Regional reanalysis | Arctic | 15 km x 15 km | 2000-2016 | 3h; Monthly | NetCDF | details |
| NARR | NCEP | Regional reanalysis | North America | 32 km x 32 km | 1979-2021 | Sub-daily; Monthly | GRIB | details |
| RDRSv2 | CCMEP/ECCC | Regional reanalysis | North America | 10 km x 10 km | 2000-2017(1980-1999 pending) | Hourly | RPN | details |
| 20CRv3 | CIRES; NOAA; DOE | Global atmospheric reanalysis | Global | T254 (approximately 75 km at the equator) | 20CRv3.SI is available for years 1836-1980 and 20CRv3.MO is available for years 1981-2015 | 3h; Daily; Monthly | NetCDF | details |
| ERA5-Land | ECMWF | Land surface reanalysis/model | Global (land only) | 0.1° x 0.1° (9 km) | 1981 to present | Hourly; Monthly | GRIB; NetCDF | details |
| AgERA5 | ECMWF | Re-gridded reanalysis | Global (land only) | 0.1° x 0.1° | 1979 to present | Daily | NetCDF | details |
| AgCFSR | NASA | Re-gridded reanalysis with corrections | Global (land only) | 0.25° × 0.25° | 1980-2010 | Daily | NetCDF | details |
| AgMERRA | NASA | Re-gridded reanalysis with corrections | Global (land only) | 0.25° × 0.25° | 1980-2010 | Daily | NetCDF | details |
| GMFD | Princeton University | Re-gridded reanalysis with corrections | Global (land only) | 0.25° × 0.25° | 1948-2016 | 3h; Daily; Monthly | NetCDF | details |
| CRU JRA | CRU/University of East Anglia | Re-gridded reanalysis with corrections | Global (land only) | 0.5° × 0.5° | 1901-2020 | 6h | NetCDF | details |
| S14FD | DIAS | Re-gridded reanalysis with corrections | Global | 0.5° x 0.5° | 1958-2013 | Daily | NetCDF | details |
| CloudSat | CIRA/Colorado State University | Satellite data | Between 80 N-S due to orbit - along track - product disseminated as tiles; retrieval not performed over land | Nominally 2 km along track and 1 km across track. The radar has a native vertical resolution of 480 m. | 2006-2011, 2011-2020 (daytime only operations, interrupted record) | Monthly | Binary; HDF | details |
| GPCP V2.3 | GSFC/NASA | Gridded hybrid data: observations, satellite | Global | 2.5° x 2.5° | 1979 to present | Monthly; Climatological means | Binary; NetCDF | details |
| GPCP V3.1 | GSFC/NASA | Gridded hybrid data: observations, satellite | Global | 0.5° x 0.5° | 1983 to present | Monthly | Binary; NetCDF | details |
| GPCP Daily | GSFC/NASA | Gridded hybrid data: observations, satellite | Global | 1° x 1° | 1996-2015 | Daily | Binary; NetCDF | details |
| CMAP/O - CPC | CPC/NOAA | Gridded hybrid data: observations, satellite | 88.75 N-S | 2.5° x 2.5° | 1979-2020 | Pentad; Monthly; Climatological means | ASCII; NetCDF | details |
| CMAP/A - CPC | CPC/NOAA | Gridded hybrid data: observations, satellite, reanalyses | 88.75 N-S | 2.5° x 2.5° | 1979-2020 | Pentad; Monthly; Climatological means | ASCII; NetCDF | details |
| IMERG v6 | NASA | Gridded hybrid data: observations, satellite | Global | 0.1° x 0.1° | 2000 to present | 30 min.; Daily; Monthly | Binary; HDF | details |
| MSWEP version 2 | GloH2O | Gridded hybrid data: observations, satellite, reanalyses | Global | 0.1° x 0.1° | 1979 to present | 3h | NetCDF | details |
The following are notes about the different types of datasets and points that should be considered when selecting a historical precipitation dataset for application in the Canadian North.
a) Station data: Measurement of rainfall and snowfall is essential for water resources planning, agriculture, power generation, irrigation, flood control and forecasting. Compared to temperature, measuring precipitation precisely is a much more difficult effort. Rain gauges are containers of a defined size that will capture the falling rain or snow. The gauge is emptied and the water amount is measured at regular intervals. However, various factors affect the amount of precipitation recorded, with wind being the main source of errors in observations. Small amounts of the captured water are unrecorded as they wet the surface of the instrument. Some of the fallen rain will evaporate before it is recorded and heavy rain may lead to splashing of the droplets, also resulting in a measurement that is lower than the actual precipitation. Low intensity and short duration precipitation events may also be under-sampled with rain gauges. On the other hand, condensation inside the gauge may increase the observed amount of water. Overall, errors in precipitation measurements can amount to 4-6% depending on wind speed and rainfall intensity (Devine and Mekis, 2008). Snow measurement is even more difficult and errors in strong winds can exceed 20% (Goodison et al., 1998). The ECCC AHCCD (see Annex 7.2.4 and Mekis and Vincent, 2011) undergoes a separate adjustment of rain and snow in order to compensate for these errors, using spatially variable correction factors for snow due to regionally different snow densities. As the map of stations in Figure 1.1 shows, station density in northern regions of Canada is low, with tens to hundreds of kilometres between stations. Given the small spatial extent of precipitation from convective cells, precipitation station data may be misleading for nearby areas (while temperatures will vary little in adjacent areas of the station, the precipitation recorded may have only affected the station but other amounts or no precipitation may have occurred in nearby areas).
b) Gridded data: Climatological data are often required in spatially distributed form rather than in the point format of stations. As mentioned in Section 2.1, to describe the coverage of large areas such as watersheds or provinces, point data are often interpolated to establish a gridded dataset, i.e. 2D value fields, with the quality and utility of such a grid depending largely on the quality and the distribution of the input data. As mentioned above, precipitation is highly variable in time and space and, unlike temperature, is not continuous in time and space. This poses difficulties for the interpolation of station data onto a grid. Ideally, each cell of the grid would contain one or more stations so that the grid-cell information would be backed by actual observed values. This may be the case in areas of high station density and for grids of a few tens of kilometre grid sizes. However, northern Canada’s station network is very sparse so that, as a function of the grid's resolution, many grid cells will not be backed by actual station data. Particularly higher temporal resolution data must therefore be used with caution as the interpolation may create misleading precipitation information. At longer temporal aggregations the spatial field of actual precipitation becomes much smother, as over a month’s or a season’s time the statistics of precipitation distribution will be smoothed (with the exception of orographic precipitation which is highly governed by the terrain). Therefore, interpolated lower temporal resolution data like monthly values are more likely to reproduce a real representation of precipitation of an area.
c) Precipitation in reanalysis and reanalysis-based products: In areas with sparse station coverage such as the Canadian North, reforecasts and reanalysis datasets provide a valuable alternative to station data and gridded datasets derived therefrom (for a comprehensive overview of reanalysis products see Section 2.1.3). While the completeness of reanalysis datasets is a clear advantage, they need to be used with caution. Their validation shows different levels of reliability in both their intercomparison and within a given dataset. For example, Rapaić et al. (2015) report particularly important spatial, seasonal, and temporal variability for precipitation over the Canadian Arctic, most pronounced in mountain regions, coastal areas and over the Canadian Arctic Archipelago. The biases vary in time and space and some reanalyses have larger wet biases (CFSR, 20CR, Rapaić, et al., 2015). The results of the evaluation appear to change with application. For example, NARR precipitation validated favourably for the Canadian North (Rapaić et al., 2015, Keller and Wahl, 2021) is recommended to be taken with care for water cycle analysis over parts of Québec by Sabarly et al. (2016). Generally, the difference between the precipitation of the reanalyses (and other gridded data) increases after around 2003 due to a stark decrease in available stations and a change in the type and collections of data assimilated in the reanalysis (Rapaic et al., 2015). Authors recommend a multi-dataset approach to compensate for the differences found in the various reanalysis data.
d) Precipitation data derived from satellites: Satellite derived precipitation data are usually a combination of one or several precipitation data with estimates derived from satellite imagery. The temporal and spatial resolution depends on the instrument used in their production. Except for geostationary satellites, most satellites give near-global coverage on some repeat cycle. For example, some satellites may sample at least once per 100 km grid cell every sixteen days (CloudSat). Depending on the orbit, they will have more frequent sampling at some latitudes than others. Here we consider only datasets that have coverage up to at least 60˚N. However, a single satellite does not fly over a region more than twice per day, and the gaps between overpasses may miss short-lived precipitation events. This is why merged or “hybrid” precipitation datasets are useful, as they can combine the observations from multiple satellite platforms to fill in some of the gaps. Typically, passive microwave or infrared instruments are used to estimate precipitation. Infrared sensors estimate cloud top temperatures, and an algorithm is used to relate the measured temperature to a precipitation estimate. Microwave-based algorithms derive precipitation from both scattering and emission from hydrometeors and cloud droplets. Note that emission cannot be used to estimate precipitation over land due to the heterogeneity of the surface emissivity. Low intensity and short duration precipitation events tend to be under-sampled. Currently, there are no studies that evaluate those datasets over the Canadian North.
References – Precipitation
Adler, R.F., M.R.P. Sapiano, G.J. Huffman, J.-J. Wang, G. Gu, D. Bolvin, L. Chiu, U. Schneider, A. Becker, E. Nelkin, P. Xie, R. Ferraro, and D.-B. Shin, 2018: The Global Precipitation Climatology Project (GPCP) Monthly Analysis (New Version 2.3) and a Review of 2017 Global Precipitation. Atmosphere, 9, 138. https://doi.org/10.3390/atmos9040138.
Beck, H.., E.F. Wood, M. Pan, C.K. Fisher, D.G. Miralles, A.I.J.M. van Dijk, T.R. McVicar, and R.F. Adler, 2019: MSWEP V2 Global 3-Hourly 0.1° Precipitation: Methodology and Quantitative Assessment. Bulletin of the American Meteorological Society 100, 3, 473-500, https://doi.org/10.1175/BAMS-D-17-0138.1.
Bromwich, D.H., A.B. Wilson, L. Bai, Z. Liu, M. Barlage, C.-F. Shih, S. Maldonado, K.M. Hines, S.-H. Wang, J. Woollen, B. Kuo, H.-C. Lin, T.-K. Wee, M.C. Serreze, and J.E. Walsh, 2018: The Arctic System Reanalysis, Version 2. Bulletin of the American Meteorological Society 99, 4, 805-828, https://doi.org/10.1175/BAMS-D-16-0215.1.
Chen, M., W. Shi, P. Xie, V.B.S. Silva, V.E. Kousky, R.W. Higgins, and J. E. Janowiak, 2008: Assessing objective techniques for gauge-based analyses of global daily precipitation. J. Geophys. Res., 113, D04110, https://doi.org/10.1029/2007JD009132.
Compo, G.P., J.S. Whitaker, P.D. Sardeshmukh, N. Matsui, R.J. Allan, X. Yin, B.E. Gleason, R.S. Vose, G. Rutledge, P. Bessemoulin, S. Brönnimann, M. Brunet, R.I. Crouthamel, A.N. Grant, P.Y. Groisman, P.D. Jones, M. Kruk, A.C. Kruger, G.J. Marshall, M. Maugeri, H.Y. Mok, Ø. Nordli, T.F. Ross, R.M. Trigo, X.L. Wang, S.D. Woodruff, and S.J. Worley, 2011: The Twentieth Century Reanalysis Project. Quarterly Journal of the Royal Meteorological Society, 137(654), 1-28, DOI: 10.1002/qj.776.
Devine, K.A., and É. Mekis, 2008: Field accuracy of Canadian rain measurements, Atmosphere-Ocean, 46(2), 213-227, DOI: 10.3137/ao.460202.
Fick, S.E. and R.J. Hijmans, 2017: WorldClim 2: new 1 km spatial resolution climate surfaces for global land areas. Int. J. Climatol, 37, 4302-4315, https://doi.org/10.1002/joc.5086.
Gasset, N., V. Fortin, M. Dimitrijevic, M. Carrera, B. Bilodeau, R. Muncaster, É.,Gaborit, G. Roy, N. Pentcheva, M. Bulat, X. Wang, R. Pavlovic, F. Lespinas, and D. Khedhaouiria, 2021: A 10 km North American Precipitation and Land Surface Reanalysis Based on the GEM Atmospheric Model. Hydrology and Earth System Sciences, 25(9), 4917-4945, https://doi.org/10.5194/hess-25-4917-2021.
Gelaro, R., W. McCarty, M. J. Suárez, R. Todling, A. Molod, L. Takacs, C.A. Randles, A. Darmenov, M.G. Bosilovich, R. Reichle, K. Wargan, L. Coy, R. Cullather, C. Draper, S. Akella, V. Buchard, A. Conaty, A.M. da Silva, W. Gu, G. Kim, R. Koster, R., Lucchesi, D. Merkova, J.E. Nielsen, G. Partyka, S. Pawson, W. Putman, M. Rienecker, S.D. Schubert, M. Sienkiewicz, and B. Zhao, 2017: The Modern-Era Retrospective Analysis for Research and Applications, Version 2 (MERRA-2). Journal of Climate, 30(14), 5419-5454. doi: 10.1175/JCLI-D-16-0758.1.
Goodison B.E., P.Y.T. Louie, and D. Yang, 1998: WMO Solid Precipitation Measurement Intercomparison, WMO/TD - No. 872, https://library.wmo.int/doc_num.php?explnum_id=9694.
Harris, I., T.J. Osborn, P. Jones, and D. Lister, 2020: Version 4 of the CRU TS monthly high-resolution gridded multivariate climate dataset. Scientific data, 7(1), 1-18 , https://doi.org/10.1038/s41597-020-0453-3.
Haynes, J.M., T.S. L'Ecuyer, G.L . Stephens, S.D. Miller, C. Mitrescu, N.B. Wood, and S. Tanelli, 2009: Rainfall retrieval over the ocean with spaceborne W-band radar. J. Geophys. Res., 114, D00A22, https://doi.org/10.1029/2008JD009973.
Hersbach, H., B. Bell, P. Berrisford, S. Hirahara, A. Horányi, J. Muñoz‐Sabater, J. Nicolas, C. Peubey, R. Radu, D. Schepers, A. Simmons, C. Soci, S. Abdalla, X. Abellan, G. Balsamo, P. Bechtold, G. Biavati, J. Bidlot, M. Bonavita, G. Chiara, P. Dahlgren, D. Dee, M. Diamantakis, R. Dragani, J. Flemming, R. Forbes, M. Fuentes, A. Geer, L. Haimberger, S. Healy, R.J. Hogan, E. Hólm, M. Janisková, S. Keeley, P. Laloyaux, P. Lopez, C. Lupu, G. Radnoti, P. Rosnay, I. Rozum, F. Vamborg, S. Villaume, and J.-N. Thépaut, 2020: The ERA5 global reanalysis. Quarterly Journal of the Royal Meteorological Society, 146(730), 1999–2049. https://doi.org/10.1002/qj.3803.
Huffman, G.J., R.F. Adler, M.M. Morrissey, D.T. Bolvin, S. Curtis, R. Joyce, B. McGavock, and J. Susskind, 2001: Global Precipitation at One-Degree Daily Resolution from Multisatellite Observations. Journal of Hydrometeorology 2, 1, 36-50, https://doi.org/10.1175/1525-7541(2001)002<0036:GPAODD>2.0.CO;2.
Iizumi, T., H. Takikawa, Y. Hirabayashi, N. Hanasaki, and M. Nishimori, 2017: Contributions of different bias-correction methods and reference meteorological forcing data sets to uncertainty in projected temperature and precipitation extremes. Journal of Geophysical Research, Atmospheres, 122(15), 7800-7819, doi: 10.1002/2017JD026613.
Keller, J.D., and S. Wahl, 2021: Representation of Climate in Reanalyses: An Intercomparison for Europe and North America. Journal of Climate, 34(5), 1667-1684, https://doi.org/10.1175/JCLI-D-20-0609.1.
Kobayashi, S., Y. Ota, Y. Harada, A. Ebita, M. Moriya, H. Onoda, K. Onogi, H. Kamahori, C. Kobayashi, H. Endo, K. Miyaoka, and K. Takahashi, 2015: The JRA-55 Reanalysis: General specifications and basic characteristics. Journal of the Meteorological Society of Japan. Ser. II, 93(1), 5-48, doi:10.2151/jmsj.2015-001.
MacDonald, H., D.W. McKenney, P. Papadopol, K. Lawrence, J. Pedlar, and M.F. Hutchinson, 2020: North American historical monthly spatial climate dataset, 1901–2016. Scientific Data, 7(1), 1-11, https://doi.org/10.1038/s41597-020-00737-2.
Mekis ,É., and L.A. Vincent, 2011: An Overview of the Second Generation Adjusted Daily Precipitation Dataset for Trend Analysis in Canada, Atmosphere-Ocean, 49(2), 163-177, https://doi.org/10.1080/07055900.2011.583910.
Mesinger, F., G. DiMego, E. Kalnay, K. Mitchell, P.C. Shafran, W. Ebisuzaki, D. Jović, J. Woollen, E. Rogers, E.H. Berbery, M.B. Ek, Y. Fan, R. Grumbine, W. Higgins, H. Li, Y. Lin, G. Manikin, D. Parrish, and W. Shi, 2006: North American Regional Reanalysis. Bulletin of the American Meteorological Society, 87(3), 343-360, doi:10.1175/BAMS-87-3-343.
Muñoz-Sabater, J., E. Dutra, A. Agustí-Panareda, C. Albergel, G. Arduini, G., Balsamo, S. Boussetta, M. Choulga, S. Harrigan, H. Hersbach, B. Martens, D. G. Miralles, M. Piles, N. J. Rodríguez-Fernández, E. Zsoter, C. Buontempo, and J.-N. Thépaut, 2021: ERA5-Land: A state-of-the-art global reanalysis dataset for land applications. Earth System Science Data, 13(9), 4349-4383, https://doi.org/10.5194/essd-2021-82.
Rapaić, M., R. Brown, M. Markovic, and D. Chaumont, 2015: An Evaluation of Temperature and Precipitation Surface-Based and Reanalysis Datasets for the Canadian Arctic, 1950–2010, Atmosphere-Ocean, 53(3), 283-303, https://doi.org/10.1080/07055900.2015.1045825.
Ruane, A.C., R. Goldberg, and J. Chryssanthacopoulos, 2015: Climate forcing datasets for agricultural modelling: Merged products for gap-filling and historical climate series estimation. Agric. Forest Meteorol., 200, 233-248, https://doi.org/10.1016/j.agrformet.2014.09.016
Sabarly, F., G. Essou, P. Lucas-Picher, A. Poulin, and F. Brissette, 2016: Use of Four Reanalysis Datasets to Assess the Terrestrial Branch of the Water Cycle over Quebec, Canada. Journal of Hydrometeorology 17, 5, 1447-1466, https://doi.org/10.1175/JHM-D-15-0093.1.
Saha, S., S. Moorthi, X. Wu, J. Wang, S. Nadiga, P. Tripp, D. Behringer, Y. Hou, H. Chuang, M. Iredell, M.Ek, J. Meng, R. Yang, M.P. Mendez, H. van den Dool, Q. Zhang, W. Wang, M. Chen, and E. Becker, 2014: The NCEP Climate Forecast System Version 2, Journal of Climate, 27(6), 2185-2208, doi:10.1175/JCLI-D-12-00823.1.
Schneider, U., P. Finger, E. Rustemeier, M. Ziese, A. Becker, 2021: Global Precipitation Analysis Products of the GPCC, Global Precipitation Climatology Centre (GPCC), Deutscher Wetterdienst, Offenbach a. M., Germany, https://opendata.dwd.de/climate_environment/ GPCC/PDF/GPCC_intro_products_lastversion.pdf.
Sheffield, J., G. Goteti, and E.F. Wood, 2006: Development of a 50-Year High-Resolution Global Dataset of Meteorological Forcings for Land Surface Modeling. Journal of Climate 19, 13, 3088-3111, https://doi.org/10.1175/JCLI3790.1.
Tan, J., G.J. Huffman, D.T. Bolvin, and E.J. Nelkin, 2019: IMERG V06: Changes to the Morphing Algorithm. Journal of Atmospheric and Oceanic Technology 36, 12, 2471-2482, https://doi.org/10.1175/JTECH-D-19-0114.1.
Tang, G., M.P. Clark, A.J. Newman, A.W. Wood, S.M. Papalexiou, V. Vionnet, and P.H. Whitfield, 2020: SCDNA: a serially complete precipitation and temperature dataset for North America from 1979 to 2018. Earth Syst. Sci. Data, 12, 2381–2409, https://doi.org/10.5194/essd-12-2381-2020.
Vincent, L.A., M.M. Hartwell and X.L. Wang, 2020: A Third Generation of Homogenized Temperature for Trend Analysis and Monitoring Changes in Canada’s Climate, Atmosphere-Ocean, 58(3), 173-191, https://doi.org/10.1080/07055900.2020.1765728.
Werner, A.T., M.A. Schnorbus, R.R. Shrestha, A.J. Cannon, F.W. Zwiers, G. Dayon, and F. Anslow, 2019: A long-term, temporally consistent, gridded daily meteorological dataset for northwestern North America. Scientific Data, 6(1), 1-16., https://doi.org/10.1038/sdata.2018.299.
Xie P., P.A. Arkin, J.E. Janowiak, 2007: CMAP: The CPC Merged Analysis of Precipitation. In: Levizzani V., P. Bauer, F.J. Turk (eds), Measuring Precipitation From Space. Advances In Global Change Research, vol 28. Springer, Dordrecht. https://doi.org/10.1007/978-1-4020-5835-6_25.
Zhang, Y., B. Qian, and G. Hong, 2020: A Long-Term, 1 km Resolution Daily Meteorological Dataset for Modeling and Mapping Permafrost in Canada. Atmosphere 2020, 11, 1363. https://doi.org/10.3390/atmos11121363.