Surface winds are provided in the form of zonal (east-west) and meridional (north-south) components, or wind speed and direction, to characterize the magnitude and orientation of air movement. Winds transport heat, moisture, and pollutants in the atmosphere at local and regional scales on timescales ranging from minutes to hours and longer, and can also be thought of as transporting their own momentum and kinetic energy through the physical process known as ‘advection’. Winds are generated by pressure-gradient forces, differences in atmospheric pressure (often due to horizontal temperature differences) that are directed from high to low pressures. These can give rise to winds over length scales spanning from the size of built structures to the size of large storm systems. Other forces that affect wind magnitude and direction include frictional drag as wind passes over the rough land, the Coriolis force due to the Earth’s rotation, and centrifugal forces associated with flow around curves. These different forces create a physical field for wind that varies highly in space and time. Due to its highly variable nature, wind presents a significant challenge to forecasting weather and making long-term climate projections for future planning.
Traditional meteorological and nautical terminology identifies winds from direction of origin, e.g. westerly or west wind meaning from the west and towards the east. The atmospheric or planetary boundary layer refers to the lower levels (up to about 2 km above the surface) of the atmosphere where frictional effects and terrain strongly influence surface winds. Near-surface winds are measured at a standard height of 10 m using anemometers and wind vanes or wind socks located at a distance of at least 10 times the height of the tallest adjacent structures, to avoid influence from strong variations in winds (eddies). It should also be noted that measurement heights of 100 m are preferable for wind-energy industry applications (Marcos et al., 2019). Wind gusts, according to Environment and Climate Change Canada, are defined as the maximum instantaneous daily wind speed when this speed exceeds 30 km/hr; other gust definitions are defined for different jurisdictions and scientific applications (e.g. Cheng et al., 2014).
Table 3.7 Examples of wind indices
| Index | Wind variable needed for computation | Definition | Applications |
|---|---|---|---|
| Wind speed and direction | Hourly or daily wind speed and/or zonal and meridional wind components | Measured wind speed and/or square root in the sum of the squares in the zonal and meridional components | Climate models and weather forecasting, aviation hazards, built infrastructure loading, wind-power generation, pollutant transport. |
| Wind power | Hourly or daily wind speed | Wind power is proportional to wind speed cubed. | Wind-power generation. |
| KVT wind index | Hourly wind speed and direction | The Kjeller Vindteknikk wind index depicts the mean wind speed for a specified timeframe relative to a normal computed over several decades for the same location and timeframe. | Wind-power monitoring and production in terms of measuring anticipated wind farm production relative to normal. |
Winds have important impacts on natural and artificial environments:
- Winds at high latitudes can shape the ice and snowscape, creating distinctive landforms through wind driven (“aeolian”) erosion and deposition, with implications for navigation and coastal inundation and relocation. Wind data is important for prediction and analysing observed and simulated sea ice motion, ocean wave heights (Vavrus and Alkama, 2021), and for characterizing extreme surface winds associated with such phenomena as landfalling atmospheric rivers (Pagano et al., 2021; Li et al., 2022) and their impacts on terrestrial and marine ecosystems.
- Wind is a significant hazard for aviation; wind data is thus also important for airport operation and safety (Leung et al., 2020). A comprehensive description of local and regional winds and implications for aviation in the Canadian Arctic may be found in the Nunavut and the Arctic Local Area Aviation Weather Knowledge manual (Hudson et al., 2003).
- Winds represent a significant design consideration for built infrastructure, which is designed to withstand peak wind speeds and associated loads. Wind loading considerations for Canadian building design requirements are outlined in Hong et al. (2014), including anemometer height adjustments, appropriate distribution fitting, and local influence from topography.
- Winds, through wind-power generation, also represent a potentially important economic factor in sustainable energy generation. Specific applications in high latitude regions include: evaluation of optimal sites for wind energy projects, such as are outlined in the Canadian pan-territorial renewable energy inventory for Nunavut, Yukon, and the Northwest Territories and, in Greenland, in consideration of wind power potential and implementation as in Qaanaaq (Kreier, 2022).
- Winds affect seed dispersal associated with Arctic shrub expansion (Liu et al., 2022) and atmospheric transport-related risks associated with permafrost degradation in response to global warming and Arctic amplification (Miner et al., 2021).
Wind data for the Canadian North exists in several forms, including as station data (MSC/ECCC, AHCDD, Hydro Quebec), gridded data (UNEP-WCMC, PCIC, and NRCan), and reanalysis products (global (ECMWF ERA5, NCEP CFSR, NASA MERRA2, JMA 20CRv3); regional (ASRv2, NARR, RDRSv2, ERA5-land); regridded (AgERA, AgCFSR, AgMERAA, GMFD, CRU JRAv2.1, S14FD); operational (ECOA, ECCC historical simulated winds).
A unique historical Canadian product, the Canadian Wind Atlas, was generated in 2004 for applications in the wind energy industry, and consists of tools derived from simulated high-resolution winds generated using a statistical-dynamical downscaling method applied to NCEP/NCAR reanalysis data for the 2008-2010 timeframe. More recently, the Global Wind Atlas, initially launched in 2015, presents similar tools, using downscaling of large-scale reanalysis climate with mesoscale and microscale modeling applied to ERA5 reanalysis winds for the 2008 – 2018 timeframe.
Wind visualization applications such as windy.com and nullschool.net complement traditional knowledge of local weather- and climate-related conditions (Simonee et al., 2021) and provide an educational resource for understanding local weather and climate events. The importance of combining local, community-driven knowledge and experience with station-based wind observations in the Canadian Arctic is highlighted in Gearheard et al. (2009), who document discrepancies in wind observations recorded by station data and experienced by Clyde River residents.
A summary of available datasets is provided in Table 3.8.
| name | source | data type | spatial domain | spatial resolution | temporal coverage | time step | data format | |
|---|---|---|---|---|---|---|---|---|
| MSC Observations | MSC/ECCC | Station data | Canada | Point data | Variable (1940 to present) | Hourly;Daily; Monthly | CSV; GeoJSON | details |
| MSC Climate Normals | MSC/ECCC | Station data | Canada | Point data | 1941-1970, 1951-1980, 1961-1990, 1971-2000 and 1981-2010 | 30-year means with a decadal increment | CSV;GeoJSON | details |
| AHCCD | CRD/ECCC | Station data | Canada | Point data | Variable (1950 to 2014) | Monthly | ASCII; CSV;GeoJSON | details |
| Hydro-Québec Station data | Hydro-Québec | Station data | Northern Québec at hydroelectric stations | Point Data | Variable,1990 to present | Variable (hourly to daily) | - | details |
| MISU | Bolin Centre for Climate ResearchStockholm University | Ship-based data | Oden cruise trajectory | Point data | August, September, 2018 | 1-minute and 30-minute averages | MatlabNetCDFCSV | details |
| WorldClim2 | UN Environment World Conservation Monitoring Centre (UNEP-WCMC) | Gridded observations | Global (land only) | 30 arc s (1 km) | 1970-2000 | Monthly | GeoTIFF | details |
| PNWNAMET | PCIC | Gridded observations | North-western North America | 3.75 arc minutes (~6 km) | 1945-2012 | Daily | ASCII;NetCDF | details |
| Met1km | NRCan | Blend of gridded products | Canada | 1 km x 1 km | 1901–2100 | Daily | None | details |
| Canadian Wind Atlas | ECCC | Numerical simulations | Canada | 2 km | 2008 – 2010 | 10 min | CSV | details |
| ERA5 | ECMWF | Global atmospheric reanalysis | Global | 0.25° x 0.25° | 1950 - present | Hourly;Daily;Monthly | GRIB; NetCDF | details |
| CFSR | NCEP | Global atmospheric reanalysis | Global | 0.5°x0.5° | 1979/01 to 2017/11 | Sub-daily;Monthly | GRIB | details |
| MERRA2 | NASA | Global atmospheric reanalysis | Global | ½° latitude x ⅝° longitude | 1980/01 to present | Hourly; Daily; Monthly | NetCDF | details |
| JRA-55 | JMA | Global atmospheric reanalysis | Global | 0.6258ᵒ x 0.6258ᵒ | 1957/12 to 2021/05 | 3h; 6h; Daily; Monthly | NetCDF | details |
| ASRv2 | Byrd Polar Research Center, The Ohio State University/ David Bromwich,NCAR,CIRES,U Illinois | Regional reanalysis | Arctic | 15 km x 15 km | 2000/01 to 2016/12 | 3h;Monthly | NetCDF | details |
| NARR | NCEP | Regional reanalysis | North America | 32 km x 32 km | 1979/01 to 2021/04 | Sub-daily; Monthly | GRIB | details |
| RDRSv2 | CCMEP/ECCC | Regional reanalysis | North America | 10 km | 2000 - 2017,(1980 - 1999 pending) | Hourly | RPN | details |
| 20CRv3 | NOAA-CIRES-DOE | Global atmospheric reanalysis | Global | T254 (approximately 75 km at the equator) | 20CRv3.SI is available for years 1836-1980 and 20CRv3.MO is available for years 1981-2015 | 3h; Daily; Monthly | NetCDF | details |
| ERA5-Land | ECMWF | Land surface reanalysis/model | Global (land only) | 0.1° x 0.1° (9 km) | 1950 to present | Hourly;Monthly | GRIB;NetCDF | details |
| ECOA | ECMWF | Operational analysis | global | 7 km | 2016-present | 6h | NetCDF | details |
| AgERA | ECMWF | Re-gridded reanalysis | Global (land only) | 0.1° x 0.1° | 1979- present | Daily | NetCDF | details |
| AgCFSR | NASA | Re-gridded reanalysis with corrections | Global (land only) | 0.25°× 0.25° | 1980-2010 | Daily | NetCDF | details |
| AgMERRA | NASA | Re-gridded reanalysis with corrections | Global (land only) | 0.25°× 0.25° | 1980-2010 | Daily | NetCDF | details |
| GMFD | Princeton University | Re-gridded reanalysis with corrections | Global (land only) | 0.25°× 0.25° | 1948-2016 | 3h;Daily; Monthly | NetCDF | details |
| CRU JRA v2.1 | University of East Anglia Climatic Research Unit (CRU) | Re-gridded reanalysis with corrections | Global (land only) | 0.5°× 0.5° | Jan.1901 - Dec. 2020 | 6h | NetCDF | details |
| S14FD | Data Integration and Analysis System (DIAS) | Re-gridded reanalysis with corrections | Global | 0.5° x 0.5° | 1958-2013 | Daily | NetCDF | details |
The following summarizes points for consideration when selecting a dataset for historical climate analyses of wind in the Canadian North:
a) Station and gridded data
Station data reveal Arctic surface winds that are 30 – 60% of regional pressure gradient speeds in winter and 60 – 70% in summer due to seasonal differences in frictional drag near the surface and in lower atmospheric static stability (Bilello, 1973). Local topographic effects, with implications for monitoring and simulations, were also noted. Onshore-offshore wind measurement comparisons in southeastern Hudson Bay using coastal and landfast station data (Larouche, 1990) showed enhanced winds offshore in winter (up to 29% higher than at coast), the magnitudes of which were governed by wind orientation due to orographic features. It was further noted that these values are lower than in summer (~65% higher than at coast) due to reduced drag over open water in summer relative to sea ice in winter. By contrast, a recent study of winds in Nares Strait shows that station data at Hans Island captures winds throughout Nares Strait due to the steep and narrow nature of the channel that favours bidirectional flow (Moore, 2021), and thus that due to the nature of topography in this region the Hans Island station provides sufficient monitoring capabilities for local and regional wind conditions.
Homogenization of station data has been shown to improve estimates of regional trends (from 1953 – 2006) in surface wind speeds (Wan et al., 2010). In this study, data from 117 sites was adjusted/standardized and homogenized to address discrepancies/discontinuities due to differences in anemometer heights (from the 10m standard), changes in station location and instrument type, and instrument malfunction in the Canadian Arctic. However, climatological (1971 – 2010) wind speed assessments from airport (non-homogenized) station data in six communities within the Labrador and Hudson Bay region in the context of aviation (Leung et al., 2022) found mean seasonal wind speed values slightly higher than those found from monthly homogenized data in Wan et al. (2010) in five of the six communities, with additional differences in trends computed from both datasets. An observed increase in the number of days where mean winds exceeded the 18.5 km/hr threshold, beyond which aircraft are required to fly into the headwinds found in coastal communities, further underscored the need to better understand shifts in prevailing wind directions in a changing climate, accounting for airport runway alignment and aircraft encounter with crosswinds. Recent studies documenting the development of homogenized daily peak wind gust datasets from 127 meteorological stations in Scandinavia, categorized according to coastal, inland, or mountainous physical processes, highlight the need for high resolution modelling (dynamical downscaling) to capture these events. For example, higher-resolution regional climate models (as fine as several km for models capable of capturing convection and clouds) are required to accurately capture wind gusts for inland and mountainous regions (Minola et al., 2021).
Comparison of meteorological measurements during the August-September 2018 field campaign on the Swedish icebreaker Oden with prior campaigns spanning several decades in the central Arctic Ocean (Vullers et al., 2021) demonstrated comparable surface wind conditions with the exception of enhanced wind speeds during the passage of storms or low pressure centres, and differences in atmospheric stability and vertical structure, also related to increased storminess in 2018. This study underlines the importance of combined ship-based, station, and reanalysis wind data for process studies and improved understanding of ice-ocean coupling relevant to forecasting and prediction, and future observational requirements in an increasingly unpredictable Arctic and changing climate.
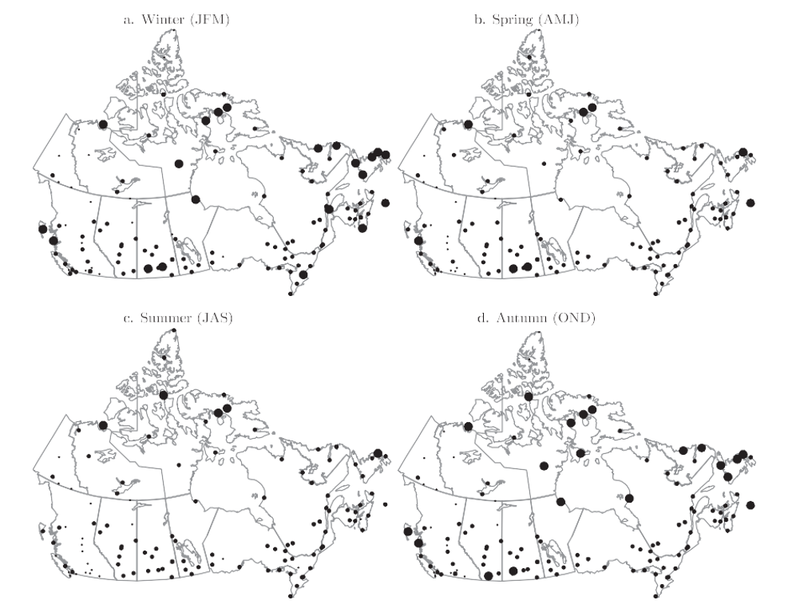
Figure xx. Map of seasonal climatological mean (1953 – 2006) for wind speeds at Canadian station locations. Small, medium, and large dots indicate mean wind speeds less than 10 km/hr, 10 – 20 km/hr, and exceeding 20 km/hr, respectively. From Wan et al. (2010).
Seasonal differences in coastal and offshore weather station data, particularly in regions with varying topography (Larouche, 1990), and observational-modeling studies underlining the need for higher model resolution to accurately capture local winds (Moore, 2021), highlight the need for more weather monitoring stations in northern Canada in the vicinity of application-based and community-driven studies. Climatological and trend analyses require the use of homogenized data to account for anemometer height differences and station relocation and instrument changes; caution should however be exercised when evaluating regional climatological trends. Wan et al. (2010) note the need for high quality local wind data such as is required for agricultural and building code applications, rather than spatially-averaged geo-winds characteristic of regional pressure gradient forces.
a) Operational and Reanalysis data
Reanalyses provide a spatially and temporally continuous dataset derived by incorporating sparsely distributed observations into forecasting and modelling systems (Bromwich et al., 2015). Recent comparisons of surface wind data demonstrate the benefits and limitations of specific reanalysis datasets in Arctic regions (Decker et al., 2012; Bromwich et al., 2016; Moore et al., 2016; Bromwich et al., 2018; Oh et al., 2020; Deng et al., 2021; Moore, 2021). Previous comparisons of reanalysis products with Arctic flux tower observations demonstrated that ERA-Interim and the Global Land Data Assimilation system ranked highest amongst reanalysis products in capturing near surface wind speeds and their variability (Decker et al., 2012). Bromwich et al. (2016) further showed that the Arctic System reanalysis (ASR) dataset more accurately captures Arctic mesoscale processes and local-scale features such as surface winds and katabatic (downslope) flow in southeast Greenland due to improvements in the assimilation of Arctic observations in a higher-resolution observational-modeling framework compared to other reanalysis products (Moore, 2016). Furthermore, examination of the spatial distribution in surface wind bias shows lower values in ASRv2 compared to ASRv1, with the largest bias for both in mountainous regions attributed to terrain variations on scales smaller than 15 km.
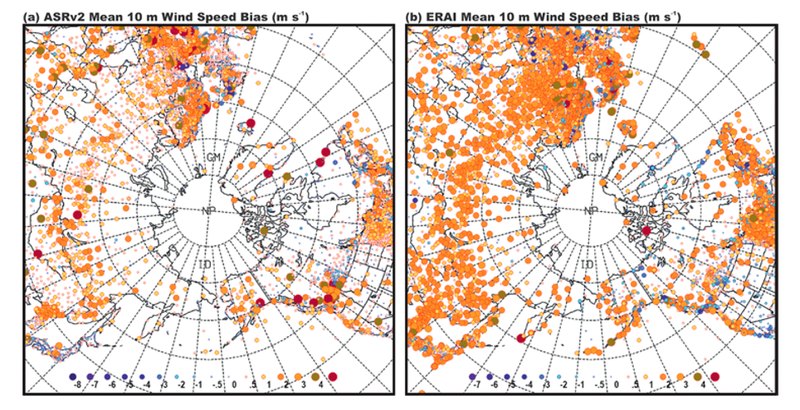
Figure xx. Map of surface wind bias for ASRv2 (left) and ERA-Interim (right) at station locations for 2000 to 2010 timeframe, showing predominantly lower bias in the former with regional topography-related limitations. From Bromwich et al. (2018).
Over the Arctic Ocean basin, examination of strengths and weaknesses in six reanalysis products over Arctic sea ice showed ERA5 to be the preferred product for 10 m wind speeds in winter and spring, and MERRA2 in summer, according to a score derived from bias, correlations, and root mean square error combined based on comparisons with observations collected along drift tracks from January to June 2015 north of Svalbard during the Norwegian Young Sea Ice Campaign (N-ICE2015) (Graham et al., 2019). Regional surface wind analyses based on long-term monitoring stations in the Beaufort/Chukchi Sea region from 1979 – 2009 document seasonal differences in coastal and inland wind speed trends in addition to increased coastal and decreased inland wind speeds (Baule and Shulsky, 2014). This study further showed that NARR winds under (over) estimate coastal (inland) wind speeds and do not capture long-term trends evident in monitoring station measurements. Recent studies demonstrate that ERA-Interim cyclone-related maximum near-surface wind speeds are lower than those for NCEP reanalysis due to a more realistic representation of frictional processes associated with a higher resolution product (Oh et al., 2020).
These results are consistent with Ramon et al.’s (2019) global study showing ERA5 to provide the most accurate representation of surface winds and interannual variability on daily timescales, with significant range amongst reanalysis surface wind speed values at higher latitudes and no particular ranking or preference in representativeness on seasonal timescales. Moore (2021) further showed that within a common/shared reanalysis data assimilation system a model resolution of approximately 9 km is required to accurately capture winds in Nares Strait, a region of significant multiyear sea ice export governed by topographic channelling, with the ECMWF Operational Analysis (ECOA) satisfying this requirement. Here it was illustrated that both the ensemble ERA5 (60 km) and ERA5 (30 km) reanalysis products underestimated surface wind weather station measurements (wind speed and direction) at Hans Island, in contrast to ECOA (9 km) for the September 2014 to 2020 timeframe considered. It was however also noted that ECOA winds underestimated maximum speeds and differed somewhat from observed orientation. Since reanalysis products such as ERA5 provides a poor estimate of wind speeds along the coast and in regions with significant variations in land use and topography this suggests the value of higher-resolution regional reanalysis products or numerical weather prediction models (Gualtieri, 2021) in such regions.
Although studies have compared Arctic extreme winds from simulations with reanalyses as ‘truth’, it is unclear which if any of the available reanalysis products captures observed Arctic wind gusts and/or extreme wind events for timescales considered. Statistical analysis of reanalysis and weather research and forecasting (WRF) extreme wind speed distributions in the Arctic highlighted the role of high-resolution gridded wind data in capturing extreme winds associated with/governed by polar lows and terrain, with implications for flux characterizations near the sea ice edge (Hughes and Cassano, 2015). However, in the absence of observations the relative performance of gridded products could not be evaluated. Sharp et al. (2015) note that CFSR, based on comparison with in situ measurements, provides a reasonable estimate of onshore/offshore winds in the UK, also stating that MERRA and CFSR capture wind extremes owing to their hourly temporal resolution, although the same may not hold at higher latitudes. It was further noted that although CFSR reflects surface wind speeds over a diversity of surfaces, accuracy deteriorates with increased elevation, which is relevant for high-topographic regions of the Canadian North.
Kislov and Platonov (2019) studied observed and simulated extreme winds in the sub-Arctic domain of the north-east Pacific using independent datasets and found based on a statistical assessment of wind distributions that atmospheric circulation patterns responsible for extreme wind events are captured by ~13.2 km model resolution, in contrast to lower resolution reanalysis products. Analysis of climate extremes in North America in reanalyses products (Avila-Diaz et al., 2021) further demonstrates that ASRv2 and ERA5 capture and provide a more realistic representation of extreme events characterized by temperature and precipitation-related indices over a 40 yearlong record; winds and dynamics were however not included in this study.
The importance of winds in accurately characterizing and forecasting Arctic sea ice loss, and minimum sea ice extent in particular, is further emphasized in a recent study documenting model biases that hinder accurate forecasting of seasonal sea ice extent. This supports continued recognition that observed winds are key to understanding and anticipating Arctic change at regional and local scales (Stroeve et al., 2007; Stroeve et al., 2012; Roach and Blanchard-Wigglesworth, 2022).
As is noted in Bromwich et al. (2018), limitations in reanalysis products include sensitivity to changes in the observing system, artificial trends due to the introduction of new observational datasets, spatial and temporal heterogeneity in observational datasets incorporated into the data assimilation system, and biases in forecasting models used to develop reanalysis products. Based on comparisons limited by the spatial domain and time interval considered for opportunistically-selected/available field campaigns, higher-resolution reanalysis products such as ECOA (~9 km) provide a reasonable estimate of surface winds in regions governed by topography and variations in terrain, albeit for a relatively restricted period starting in 2016. On the other hand, ECMWF-based reanalysis products (ERA5) provide the most realistic estimate of near surface winds in winter and summer, and MERRA2 in summer over Arctic sea ice, over the period since 1980.
As is emphasized in throughout this report, for all studies of the Canadian North, a suite of products (station data, reanalysis and hybrid datasets) should be used, particularly for evaluating winds governed by local conditions, for specific applications.
References- Wind
Avila-Diaz, A., D. Bromwich, A. Wilson, F. Justino, S.-H. Wang, 2021: Climate extremes across the North American Arctic in Modern Reanalyses. J. Climate, 34, 2385 – 2410, DOI: 10.1175/JCLI-D-20-0093.1
Bilello, M., 1973: Prevailing winds in the Arctic. Prepared for advanced research projects agency ARPA order 1615 by Corps of Engineers, U.S. Army Cold Regions Research and Engineering Laboratory (CRREL), Hanover, New Hampshire, 55 pages, https://erdc-library.erdc.dren.mil/jspui/bitstream/11681/5854/1/CRREL-Research-Report-306.pdf
Bromwich, D., Y.-H. Kuo, M. Serreze, J. Walsh, L.-S. Bai, M. Barlage, K. Hines, and A. Slater, 2010: Arctic System Reanalysis: Call for Community Involvement. Eos Trans. AGU, 91, 13, https://doi.org/10.1029/2010eo020001.
Bromwich, D. H., A. B.Wilson, L.-S. Bai, G.W.K. Moore, and P. Bauer, 2018: A comparison of the regional Arctic System Reanalysis and the global ERA-Interim Reanalysis for the Arctic. Bulletin of the American Meteorological Society. 99, 4, 805 – 828, https://doi.org/10.1175/BAMS-D-16-0215.1
Cheng CS, Lopes E, Fu C, Huang Z, 2014: Possible impacts of climate change on wind gusts under downscaled future climate conditions: updated for Canada. J Clim 27(3), 1255–1270
Compo, G.P., J.S. Whitaker, P.D. Sardeshmukh, N. Matsui, R.J. Allan, X. Yin, B.E. Gleason, R.S. Vose, G. Rutledge, P. Bessemoulin, S. Brönnimann, M. Brunet, R.I. Crouthamel, A.N. Grant, P.Y. Groisman, P.D. Jones, M. Kruk, A.C. Kruger, G.J. Marshall, M. Maugeri, H.Y. Mok, Ø. Nordli, T.F. Ross, R.M. Trigo, X.L. Wang, S.D. Woodruff, and S.J. Worley, 2011: The Twentieth Century Reanalysis Project. Quarterly Journal of the Royal Meteorological Society, 137(654), 1-28, DOI: 10.1002/qj.776.
Fick, S.E., and R.J. Hijmans, 2017: WorldClim 2: new 1‐km spatial resolution climate surfaces for global land areas. Int. J. Climatol, 37, 4302–4315, https://doi.org/10.1002/joc.5086.
Gasset, N., V. Fortin, M. Dimitrijevic, M. Carrera, B. Bilodeau, R. Muncaster, É.,Gaborit, G. Roy, N. Pentcheva, M. Bulat, X. Wang, R. Pavlovic, F. Lespinas, and D. Khedhaouiria, 2021: A 10 km North American Precipitation and Land Surface Reanalysis Based on the GEM Atmospheric Model. Hydrology and Earth System Sciences, 25(9), 4917-4945, https://doi.org/10.5194/hess-25-4917-2021.
Gearheard, S., Pocernich, M., Stewart, R. et al., 2009: Linking Inuit knowledge and meteorological station observations to understand changing wind patterns at Clyde River, Nunavut. Climatic Change 100, 267–294. https://doi.org/10.1007/s10584-009-9587-1
Gelaro, R., W. McCarty, M.J. Suárez, R. Todling, A. Molod, L. Takacs, C.A. Randles, A. Darmenov, M.G. Bosilovich, R. Reichle, K. Wargan, L. Coy, R. Cullather, C. Draper, S. Akella, V. Buchard, A. Conaty, A.M. da Silva, W. Gu, G. Kim, R. Koster, R., Lucchesi, D. Merkova, J.E. Nielsen, G. Partyka, S. Pawson, W. Putman, M. Rienecker, S.D. Schubert, M. Sienkiewicz, and B. Zhao, 2017: The Modern-Era Retrospective Analysis for Research and Applications, Version 2 (MERRA-2). Journal of Climate, 30(14), 5419-5454. doi: 10.1175/JCLI-D-16-0758.1.
Graham, R. M., Hudson, S. R., & Maturilli, M., 2019: Improved performance of ERA5 in Arctic gateway relative to four global atmospheric reanalyses. Geophysical Research Letters, 46, 6138– 6147. https://doi.org/10.1029/2019GL082781.
Gualtieri, Giovanni. 2021. "Reliability of ERA5 Reanalysis Data for Wind Resource Assessment: A Comparison against Tall Towers" Energies 14, no. 14: 4169. https://doi.org/10.3390/en14144169
Hersbach, H., B .Bell, P. Berrisford, S. Hirahara, A. Horányi, J. Muñoz‐Sabater, J. Nicolas, C. Peubey, R. Radu, D. Schepers, A. Simmons, C. Soci, S. Abdalla, X. Abellan, G. Balsamo, P. Bechtold, G. Biavati, J. Bidlot, M. Bonavita, G. Chiara, P. Dahlgren, D. Dee, M. Diamantakis, R. Dragani, J. Flemming, R. Forbes, M. Fuentes, A. Geer, L. Haimberger, S. Healy, R.J. Hogan, E. Hólm, M. Janisková, S. Keeley, P. Laloyaux, P. Lopez, C. Lupu, G. Radnoti, P. Rosnay, I. Rozum, F. Vamborg, S. Villaume, and J.-N. Thépaut, 2020: The ERA5 global reanalysis. Quarterly Journal of the Royal Meteorological Society, 146(730), 1999–2049. https://doi.org/10.1002/qj.3803.
Hong, H.P., T.G. Mara, R. Morris, S.H. Li, and W. Ye, 2014: Basis for recommending an update of wind velocity pressures in Canadian design codes. Canadian Journal of Civil Engineering. 41(3): 206-221. https://doi.org/10.1139/cjce-2013-0287
Hughes, M., and Cassano, J. J., 2015: The climatological distribution of extreme Arctic winds and implications for ocean and sea ice processes. Journal of Geophysical Research: Atmospheres., 120, 7358– 7377. doi: 10.1002/2015JD023189.
Iizumi, T., H. Takikawa, Y. Hirabayashi, N. Hanasaki, and M. Nishimori, 2017: Contributions of different bias‐correction methods and reference meteorological forcing data sets to uncertainty in projected temperature and precipitation extremes. J. Geophys. Res. Atmos., 122, 7800–7819, https://doi.org/10.1002/2017jd026613.
Kislov, A. and Platonov, V., 2019: Analysis of Observed and Modelled Near-Surface Wind Extremes over the Sub-Arctic Northeast Pacific. Atmospheric and Climate Sciences, 9, 146-158. doi: 10.4236/acs.2019.91010.
Kobayashi, S., Y. Ota, Y. Harada, A. Ebita, M. Moriya, H. Onoda, K. Onogi, H. Kamahori, C. Kobayashi, H. Endo, K. Miyaoka, and K. Takahashi, 2015: The JRA-55 Reanalysis: General specifications and basic characteristics. Journal of the Meteorological Society of Japan. Ser. II, 93(1), 5-48, doi:10.2151/jmsj.2015-001.
Kreier, F., 2022: The quest to bring renewable energy to the top of the world. Nature, 605, 406-407.
Leung, A.C.W., W.A. Gough, K.A. Butler, T. Mohsin, M.J. Hewer, 2022: Characterizing observed surface wind speed in the Hudson Bay and Labrador regions of Canada from an aviation perspective. International Journal of Biometeorology (2022) 66:411–425, https://doi.org/10.1007/s00484-020-02021-9
Liu, Y., Riley, W.J., Keenan, T.F. et al. Dispersal and fire limit Arctic shrub expansion. Nat Commun 13, 3843 (2022). https://doi.org/10.1038/s41467-022-31597-6
Marcos, R., González-Reviriego, N., Torralba, V. et al. Characterization of the near surface wind speed distribution at global scale, 2019: ERA-Interim reanalysis and ECMWF seasonal forecasting system 4. Climate Dynamics. 52, 3307–3319. https://doi.org/10.1007/s00382-018-4338-5
Mesinger, F., G. DiMego, E. Kalnay, K. Mitchell, P. C. Shafran, W. Ebisuzaki, D. Jović, J. Woollen, E. Rogers, E.H. Berbery, M.B. Ek, Y. Fan, R. Grumbine, W. Higgins, H. Li, Y. Lin, G. Manikin, D. Parrish, and W. Shi, 2006: North American Regional Reanalysis. Bulletin of the American Meteorological Society, 87(3), 343-360, doi:10.1175/BAMS-87-3-343.
Minola, L., Azorin-Molina, C., Guijarro, J. A., Zhang, G., Son, S.-W., & Chen, D., 2021: Climatology of near-surface daily peak wind gusts across Scandinavia: Observations and model simulations. Journal of Geophysical Research: Atmospheres, 126, e2020JD033534. https://doi.org/10.1029/2020JD033534
Moore GWK, 2021: Impact of model resolution on the representation of the wind field along Nares Strait. Sci Rep. 11(1):13271. doi: 10.1038/s41598-021-92813-9.
Moore, G.W.K., Bromwich, D.H., Wilson, A.B., Renfrew, I. and Bai, L., 2016: Arctic System Reanalysis improvements in topographically forced winds near Greenland. Quarterly Journal of the Royal Meteorological Society, 142: 2033-2045. https://doi.org/10.1002/qj.2798
Muñoz-Sabater, J., E. Dutra, A. Agustí-Panareda, C. Albergel, G. Arduini, G., Balsamo, S. Boussetta, M. Choulga, S. Harrigan, H. Hersbach, B. Martens, D. G. Miralles, M. Piles, N. J. Rodríguez-Fernández, E. Zsoter, C. Buontempo, and J.-N. Thépaut, 2021: ERA5-Land: A state-of-the-art global reanalysis dataset for land applications. Earth System Science Data, 13(9), 4349-4383, https://doi.org/10.5194/essd-2021-82.
Oh, S.-G., L. Sushama. B. Teufel, 2020: Arctic precipitation and surface wind speed associated with cyclones in a changing climate. Climate Dynamics, 55:3067 – 3085, https://doi.org/10.1007/s00382-020-05425-w
Prytherch, J., 2021: Weather data from MISU weather station during the Arctic Ocean 2018 expedition. Dataset version 3. Bolin Centre Database. https://doi.org/10.17043/oden-ao-2018-misu-weather-3
Ramon, J, Lledó, L, Torralba, V, Soret, A, Doblas-Reyes, FJ, 2019: What global reanalysis best represents near-surface winds?. Quarterly Journal of the Royal Meteorological Society. 145: 3236– 3251. https://doi.org/10.1002/qj.3616
Roach, L., E. Blanchard-Wrigglesworth, 2022: Observed winds crucial for September Arctic sea ice loss, Geophysical Research Letters, 49, e2022GL097884. https:doi.org/10.1029/2022GL097884.
Ruane, A.C., R. Goldberg, and J. Chryssanthacopoulos, 2015: Climate forcing datasets for agricultural modeling: Merged products for gap-filling and historical climate series estimation. Agricultural and Forest Meteorology, 200, 233–248, https://doi.org/10.1016/j.agrformet.2014.09.016.
Saha, S., S. Moorthi, X. Wu, J. Wang, S. Nadiga, P. Tripp, D. Behringer, Y. Hou, H. Chuang, M. Iredell, M.Ek, J. Meng, R. Yang, M.P. Mendez, H. van den Dool, Q. Zhang, W. Wang, M. Chen, and E. Becker, 2014: The NCEP Climate Forecast System Version 2, Journal of Climate, 27(6), 2185-2208, doi:10.1175/JCLI-D-12-00823.1.
Sharp, E., P. Dodds, M. Barrett, C. Spataru, 2015: Evaluating the accuracy of CFSR reanalysis hourly wind speed forecasts for the UK, using in situ measurements and geographical information. Renewable Energy, Volume 77, Pages 527-538, ISSN 0960-1481,
https://doi.org/10.1016/j.renene.2014.12.025.
Sheffield, J., G. Goteti, and E.F. Wood, 2006: Development of a 50-Year High-Resolution Global Dataset of Meteorological Forcings for Land Surface Modeling. Journal of Climate, 19, 3088–3111, https://doi.org/10.1175/jcli3790.1.
Simonee, N., J. Alooloo, N. Carter, G. Ljubicic, J. Dawson, 2021: Sila Qanuippa? (How’s the Weather?): Integrating Inuit Quajimajatuqangit and Environmental Forecasting Products to Support Travel Safety around Pond Inlet, Nunavut, in a Changing Climate. 13, 4, 933-962, doi:
https://doi.org/10.1175/WCAS-D-20-0174.1.
Stroeve, J., Holland, M. M., Meier, W., Scambos, T., and Serreze, M., 2012: Arctic sea ice decline: Faster than forecast, Geophysical Research Letters, 34, L09501, doi:10.1029/2007GL029703.
Stroeve, J. C., Kattsov, V., Barrett, A., Serreze, M., Pavlova, T., Holland, M., and Meier, W. N., 2012: Trends in Arctic sea ice extent from CMIP5, CMIP3 and observations, Geophys. Res. Lett., 39, L16502, doi:10.1029/2012GL052676.
Vüllers, J., Achtert, P., Brooks, I. M., Tjernström, M., Prytherch, J., Burzik, A., and Neely III, R., 2021: Meteorological and cloud conditions during the Arctic Ocean 2018 expedition, Atmos. Chem. Phys., 21, 289–314, https://doi.org/10.5194/acp-21-289-2021.
Wan, H., X.L. Wang, and V.R. Swail, 2010: Homogenization and Trend Analysis of Canadian Near-Surface Wind Speeds. Journal of Climate, 23, 1209–1225, https://doi.org/10.1175/2009jcli3200.1.
Werner, A.T., M.A. Schnorbus, R.R. Shrestha, A.J. Cannon, F.W. Zwiers, G. Dayon, and F. Anslow, 2019: A long-term, temporally consistent, gridded daily meteorological dataset for northwestern North America. Sci Data, 6, https://doi.org/10.1038/sdata.2018.299.
Zhang, Y., B. Qian, and G. Hong, 2020: A Long-Term, 1-km Resolution Daily Meteorological Dataset for Modeling and Mapping Permafrost in Canada. Atmosphere, 11, 1363, https://doi.org/10.3390/atmos11121363.