Lead authors: Emilia Diaconescu (CCCS/ECCC) and Paul Kushner (University of Toronto)
This report principally considers the following data sources for the Canadian North: station data (overview in Section 2.1.1), gridded observations (Section 2.1.2), reanalysis (Section 2.1.3), and remote sensing datasets. These sources represent the distinctive ways in which climate data is provided, as either point-specific (e.g. station data, site measurements) or gridded (e.g. reanalysis, regridded observations, remote sensing gridded datasets). Point data conveys information specific to an identified location where measurements are taken, while gridded data provides information representative of the average or typical values within the area or volume covered by a set of grid cells. To repeat, variables in a gridded product should typically be interpreted as a mean value over the grid cell and not representative of a point measurement. To more precisely relate grid values to local measurements requires the use of downscaling methods that will be mentioned in connection with specific applications.
2.1.1 Station data
Weather stations and field sites provide the most reliable and accurate measurements of several of the variables considered in this report, such as temperature, precipitation, humidity, wind, snow depth, snow water equivalent, river discharge, etc.. However, station infrastructure and maintenance are costly and require deep technical expertise to maintain, or, in the case of field sites, provide project-specific coverage. This limits the number and distribution of measurement stations in the Canadian North compared to the Canadian South. For example, weather stations in the Canadian North are located on the coast or in valleys, and there are limitations in stations in interior land regions (see Section 3.1 and Figure 2.1). When using multiple-decade weather-station data, climate analysis must account for missing values, records that cover different periods, changes in instrumentation and changes in the location. Changes in instrumentation, location, and sampling need to be acccounted for to avoid the appearance of spurious climate shifts. For example, in 1961 there was a change in the observing time at principal stations which affected daily minimum temperature records.
The adjusted and homogenized Canadian climate dataset (AHCCD, Mekis and Vincent 2011; Vincent et al. 2012, 2020) of ECCC resolves some of these issues for several climate variables of focus in this report. In this product, daily observations from nearby sites are often merged into a single record to create a longer time series, and records were tested for artificial shifts (that could be caused by changes in the location of the stations) and homogenized (i.e. adjusted to account for artificial shifts). Presently, this group recommends that AHCCD be used as the best dataset to analyze local climate evolution over a long period of time in Canada. This reflects current best practice, since AHCCD is often used to validate other gridded datasets and models. Detailed descriptions of records from AHCCD are provided in Annexes (i.e. annexes for temperature, precipitation, and wind). Note that the number of locations with available AHCCD data is in general small in the Canadian North (even fewer locations than for MSC stations as a whole).
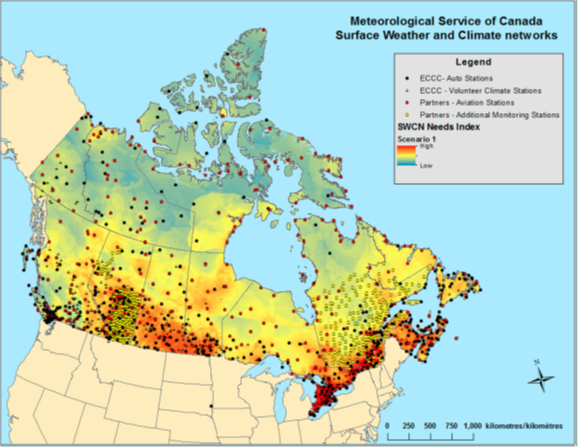
Figure 2.1. Surface weather stations across Canada, as of September 2016, with a Needs Index map in the background. For further details on station network evolution see Mekis et al. 2018. [Source: Mekis et al., 2018].
2.1.2 Gridded station-based data
Point data from stations can be transformed to gridded products using a range of mathematical and statistical interpolation methods. These methods range from simpler, such as inverse distance weighting, trend surface analysis, splines (used in ANUSPLIN, and WorldClim2), Thiessen polygons; to more complex, such as krieging or regression models (used in PNWNAMET). While provided with nominal spatial resolution as fine as 1 km (e.g. Daymet, WorldClim2), the suitability of these datasets in the Canadian North has generally not been well characterized. Across several interpolation methods, the primary factor that influences their skill is the density of the station network, with topographic complexity, and how this is taken into account in the model, being an important secondary factor (Hofstra et al. 2008). Only some of these datasets account for elevation effects (e.g. ANUSPLIN, PNWNAMET, WorldClim2, Daymet). As the mean distance between the stations that are gridded becomes larger than 100 km, the effectiveness of all interpolation methods degrades. Such effects are pronounced in the analysis of temperature and precipitation extremes, as has been demonstrated for European station data (Hofstra et al. 2010), for which interpolated daily values are systematically reduced relative to the ‘true’ areal mean. This strongly affects the climate variables with a relatively high spatial variance, such as precipitation relative to temperature, but can also affect variables such as surface temperature in mountainous regions of strong topographic variability. Large parts of the Canadian North, with prominent topography in Western Canada and sparse inland station distribution, are in this situation (Figure 2.1). Spatial and time variability is greater in high topographic regions and at daily time steps, but this effect decreases for monthly and annual means.
Therefore, despite their past use, the use of datasets obtained with gridding methods for regions of the Canadian North that feature a sparse network of stations should be approached cautiously. Local conditions should be considered when selecting the dataset obtained with a gridding method. For example, applications with a good coverage of stations over a small watershed could consider the use of a gridded dataset. If the region has important topographic variations, a method that incorporates elevation information should be used (see Section 3.1 for further discussion on these points related to temperature). For regions with a small number of stations, products that make use of assimilation of observaions and model output (e.g. RDRSv2) could be a good alternative to grided observations[PK2] [D(3] .
Because of the demand for higher-resolution products in many applications, this report generally focuses on recent versions of datasets that are provided at a nominal spatial resolution finer than about 60 km/0.5°, covering the Canadian North or parts of the Canadian North. With our interest in using this data for climate applications, we retained only datasets with a duration spanning a decade or more. Nevertheless, the concerns above regarding use of infilled data from sparse networks should be borne in mind.
2.1.3 Reanalysis and reanalysis-based datasets: description
Reanalyses represent a valuable complement to gridded station data based solely on infilling between stations. Reanalyses are produced by assimilating observational data (e.g. radiance information from available satellites and in situ observations, including land stations, marine observations, aircraft, rawinsonde, and profiler data) into numerical weather prediction models over long historical periods (see Cullather et al. (2016) for a comprehensive review). Reanalyses offer a large number of meteorological and land-surface variables that preserve the physical relationships between them and cover a long period and spatial scales from regional to global in a uniform and self-consistent manner. Available at increasingly fine resolution, they represent a valuable source of data for impact models or climate models that require the input of several variables with physical self-consistency. Practitioners should pay careful attention to the horizontal resolution of each reanalysis product (e.g. 0.25 degree to 1 degree) and recognize the limitations of its temporal sampling (e.g. 1h, 3h, 6h, daily).
The quality of observations, of the assimilation process, and the underlying numerical model determine the accuracy of the reanalysis product. Where observations are relatively sparse, reanalyses output is more strongly influenced by the forecast model. As previously noted, the Canadian North has a limited number of in situ observations. Additionally, satellite sensors have difficulty in profiling the lower atmosphere over snow- and ice-covered surfaces, and geostationary satellites do not cover the high latitudes (Cullather et al. 2016). Consequently, the observations provide less of a constraint on reanalysis over the Canadian North compared to the Canadian South. It should also be noted that if at a certain moment a new type of observation is introduced into the data assimilation scheme (e.g. new satellite data) the output will subsequently be more constrained by observations than in the previous period. This may produce artificial trends or variability in the estimated variables.
Accounting for their known limitations, reanalyses, especially those accompanied by quantification of uncertainty of state estimates, remain the best and most consistent continuous estimates of the state of the atmosphere, and in some cases, the only estimates that are available (Cullather et al., 2016). For example, seasonal forecasts over the Arctic are presently verified by comparing model estimates with reanalyses data for many variables, including 2 m temperature (see presentations on Arctic Regional Climate Centre (arctic-rcc.org)). In this report, our discussion on reanalysis products focuses on four important centers that produce global atmospheric reanalyses: the European Centre for Medium-Range Weather Forecasts (ECMWF), the National Aeronautics and Space Administration (NASA), the National Centers for Environmental Prediction (NCEP) and the Japan Meteorological Agency (JMA). We will frequently refer to ECMWF’s ERA5, NASA’s MERRA and MERRA-2, NCEP’s CFSR, and JMA’s JRA-55 reanalysis products (see List of Acronyms for acronym definitions).
The need to refine the spatial resolution of reanalyses and optimize performance in specific regions has prompted the introduction of regional reanalyses and re-forecasting using fine resolution limited-area numerical prediction models (e.g., NCEP’s NARR, ASRv2 developed by Byrd Polar Research Center, ECCC’s RDRSv2). Those approaches simulate the atmosphere and/or land state at a finer resolution than the global reanalyses, and continuous assimilation of observations will limit the model tendency to drift and thereby limit errors relative to dynamical downscaling approaches. From the three regional products that cover the Canadian North, NARR has coarser spatial resolution than global reanalysis ERA5 (32 km comparative to approximately 28 km), while ASRv2 (15 km) and RDRSv2 (10 km) are new products that cover just the recent period.
In addition, global atmospheric reanalyses can be used to force advanced land surface models at a finer resolution (e.g., MERRA-Land, ERA-Land). Observations in land surface models have an indirect influence through the atmospheric forcing used to run the land model; this indirect influence can bring about some drift of the model state. On the other hand, self-consistency of physical laws and finer resolution, providing accurate incorporation of terrain influences, are strengths of this approach. ERA5-Land, for example, provides 2 m temperature at 10 km spatial resolution, while the corresponding driving variable from ERA5 is at approximately 28 km.
Other approaches to obtain high-resolution data consists in downscaling of global atmospheric reanalyses with, or without, bias correction (e.g., AgMERRA, AgCFSR, AgERA, GMFD, CRU JRA, S14FD). AgMERRA (approximately 28 km; based on MERRA reanalysis), AgCFSR (approximately 28 km; based on CFSR reanalysis) and AgERA (10 km; based on ERA reanalysis) were developed to be used as input for agriculture and agro-ecological studies. Therefore, sub-hourly data for several surface meteorological data were aggregated at a daily time step (for air temperature, the daily data is provided for the mean, minimum and maximum daily temperature). GMFD (approximately 28 km; based on NCEP/NCAR reanalysis), CRU JRA (approximately 56 km; based on JRA-55) and S14FD (approximately 56 km; based on JRA-55) were developed to serve as forcing datasets for different impact models. All those products use as a downscaling approach interpolation methods to obtain the increase in nominal resolution. Information about specific variables available from all those reanalyses is provided in Chapter 3.
Practitioners should be aware of which data is assimilated in a given reanalysis; while this is documented in the products compiled here, identifying data sources used in assimilation remains a challenge for new and even experienced users. One general point is that even if reanalyses assimilate many observations, the greatest number of observations are from satellite data, which began to be collected in earnest in the early 1970’s and became a regular part of operational assimilation from the start of the ‘satellite era’, 1979. More specifically, MERRA, CFSR, and NCEP do not assimilate surface temperature and precipitation measurements at stations. It should also be noted that, ERA5, NARR, and RDRSv2 assimilate in some ways surface temperature from stations. JRA-55 assimilates indirectly some surface temperature measurements, as well as passive microwave for snow cover, but not precipitation (Kobayashi et al., 2015). AgMERRA, AgCFSR, GMFD, CRU JRA and S14FD, downscale surface variables from the global atmospheric reanalyses at a higher resolution and/or correct them with surface station data. Such corrections and the downscaling process can affect the relationship between variables for each dataset. Therefore, for the Canadian North, the corrections do not a priori assure a better dataset than those from the “parent” global reanalyses or from regional products with similar or finer spatial resolution (e.g., ERA5, ASRv2, RDRSv2, ERA5-Land), which as stated previously maintain self-consistency corresponding to the resolution of the parent model. AgMERRA, AgCFSR, GMFD datasets were not updated since 2014 and there are no plans to continue them. AgERA5 is a new product based on ERA5. AgERA5 does not correct the ERA5 bias; it just aggregates to daily time steps at the local time zone and corrects the fields towards a finer topography using regression equations trained on ECMWF's operational high-resolution atmospheric model (HRES) at a 0.1° resolution.
In the peer-reviewed literature, comparison of reanalysis products with gridded station products (Section 2.1.2) is commonly carried out but is subject to representation errors (Keller and Wahl, 2021; Cullather et al., 2016), since the area average representation of gridded datasets strongly depends on the density of observations. Comparison of reanalysis with in-situ measurements and stations (Section 2.1.1) is also subject to representation errors, especially in regions with complex topography or surface heterogeneity (Keller and Wahl, 2021). Comparisons of these kinds should be done using independent, validating data (observations that are not integrated or assimilated by the reanalysis), which in some cases it is difficult to find. Validation against data that is assimilated will tend to give good results at those specific locations but does not guarantee good results far from those points.
Overall, practitioners should keep in mind the following key points related to use of reanalyses:
- Caution should be exercised in applying reanalysis to the Canadian North and in particular should ensure a good characterization of how different reanalyses represent variables of interest close to station or field measurement locations, as sparse as they are. It can be expected that reanalyses are closer to station observations at those locations but diverge in regions without stations.
- Care should be taken when using reanalyses to define trends or variability over a long period of time as the changes in the amounts and types of observational data that is assimilated by them may produce artificial trends or variability along the dataset time series.
- The overarching conclusion of Przybylak and Wyszyński (2020) (see also Serreze and Barry, 2014) should also be considered: ‘’due to discrepancies in reanalyses, it is necessary to take under consideration the averages from multiple reanalysis' data to properly analyse the mean state of the Arctic climate system.’’