Near-surface air surface temperature named 2 m temperature because "surface" air temperature observations are taken at 2 m above ground is one of the most commonly recorded climate variables. Information about this variable is important for many socio-economic sectors of activity (e.g., health, agriculture, energy demand, transportation) because of its impact on humans as well as on natural systems. Temperature data (including mean, daily range, degree hours, and seasonal percentages within ranges of values) are standard data incorporated into “weather files” used for designing, planning, and sizing building energy systems and equipment. There is a large variety of indices based on this variable that are defined according to context-specific applications: from mean climatological values to extremes and threshold-based indices. Some of those indices are computed using 2 m daily-mean temperature (Tmean), other using 2 m daily-minimum temperature (Tmin) or 2 m daily-maximum temperature (Tmax). Table 3.2 provide the definition of some of the most commonly used temperature climate indices that are important for the Canadian North.
Table 3.2 Examples of temperature climate indices important for the Canadian North (Source: Climdex project and ClimateData.ca).
| Index | Temperature variable needed for computation | Definition | Sample applications |
|---|---|---|---|
| Winter temperature (mean and variation) | Tmean | The average and standard deviation of Tmean over the winter season | Seasonal winter trail conditions and safety |
| 5°C Growing Degree Days (GDDs) | Tmean | The number of degree days accumulated above a threshold temperature of 5°C in the selected time period. | 5°C GDDs is a measure of whether climate conditions are warm enough to support plant and insect growth. When the daily average temperature is warmer than the threshold temperature, growing degree days are accumulated. For forage crops, a threshold temperature of 5°C is generally used. |
| Heating Degree Days (HDDs) | Tmean | The number of degree days accumulated below 17°C or 18°C in the selected time period. (threshold values may vary, but 17°C or 18°C are commonly used in Canada). | HDDs give an indication of the amount of space heating (e.g., from a gas boiler/furnace, baseboard electric heating or fireplace) that may be required to maintain comfortable conditions inside a building during cooler months. When the daily average temperature is colder than the threshold temperature, HDDs are accumulated. Larger HDD values indicate a greater need for space heating. |
| Hottest temperature of the year | Tmax | Maximum annual value of Tmax. | High temperatures have an impact on human and ecosystem health, define the design of buildings and vehicles, and shape the transportation and energy use. |
| Ice days | Tmax | Annual count of days when Tmax < 0 °C. Let Tmaxij be daily maximum temperature on day i in year j. Count the number of days where Tmaxij < 0 °C.Annual count of days when Tmax < 0 °C. Let Tmaxij be daily maximum temperature on day i in year j. Count the number of days where Tmaxij < 0 °C. | This index indicates the number of days when temperatures have remained below freezing for the entire 24-hour period. This index is an indicator of the length and severity of the winter season, and is important for winter roads season and to evaluate the health of foragers. |
| Coldest temperature of the year | Tmin | Minimum annual value of Tmin | Cold weather is an important aspect of life in northern Canada. Cold temperatures affect human health and safety, determine what plants and animals can live in the area, limit or enable outdoor activities, define the design of buildings and vehicles, and shape the transportation and energy use. |
| Last Spring Frost | Tmin | The spring date after which there are no Tmin less than 0°C during the growing season. | The Last Spring Frost marks the approximate beginning of the growing season for frost-sensitive crops and plants. |
| First Fall Frost | TminTmin | The first date in the fall (or late summer) on which Tmin is less than 0°C. | The First Fall Frost marks the approximate end of the growing season for frost-sensitive crops and plants. |
Consequently, the following table (Table 3.3) provides information about existing datasets with sub-daily 2 m temperature data (which can be used to estimate the daily mean, minimum or maximum temperature), daily mean temperature as well as existing datasets that provides daily minimum and daily maximum temperatures.
For each dataset, a link to summaries describing the metadata is provided.
| name | source | data type | spatial domain | spatial resolution | temporal coverage | time step | data format | |
|---|---|---|---|---|---|---|---|---|
| MSC Observations | MSC/ECCC | Station data | Canada | Point data | Variable (1940- present) | Hourly; Daily; Monthly | CSV; GeoJSON | details |
| MSC Climate Normals | MSC/ECCC | Station data | Canada | Point data | 1941-1970; 1951-1980; 1961-1990; 1971-2000; 1981-2010. | Climatological means | CSV; GeoJSON | details |
| MSC Daily Climate Records (LTCE, Long Term Climate Extremes) | MSC/ECCC | Station data | Canada | Point data | Variable | Records for each day of the year | CSV; GeoJSON | details |
| AHCCD | CRD/ECCC | Station data | Canada | Point data | Variable (1950 to present) | Daily; Monthly; Seasonal; Annual | ASCII; CSV; GeoJSON | details |
| Hydro-Québec Station data | Hydro-Québec | Station data | Northern Québec at hydroelectric stations | Point Data | Variable (1990 to present) | Variable ( sub-daily to daily) | None | details |
| White Pass Railway & River Divisions dataset, Yukon | Yukon Research Centre | Station data from archives | The upper Yukon River basin | Point data | 1902-1957 | Daily | Excel files | details |
| SCDNA | University of Saskatchewan | Station data and reanalyses blend | North America | Point data | 1979-2018 | Daily | NetCDF | details |
| CANGRD | CRD/ECCC | Gridded observations | Canada | 50 km x 50 km | 1948-2017 (anomalies) | Monthly; Seasonal; Annual | CSV; GeoJSON | details |
| ANUSPLIN | CFS/NRCan | Gridded observations | Canada and North America | (10 km x 10 km) and (2 km x 2 km) | 1950-2017 | Daily; Pentad; Monthly; Climatological means | ASCII; NetCDF | details |
| CRU TS Version 4 | CRU/University of East Anglia | Gridded observations | Global (land only) | 0.5° x 0.5° | 1901–2018 | Monthly | NetCDF | details |
| WorldClim2 | World Conservation Monitoring Centre/UNEP | Gridded observations | Global (land only) | 10 arc minutes (~340 km);5 arc minutes;2.5 arc minutes; 30 arc seconds (1 km) | 1970-2000 | Monthly | GeoTIFF | details |
| Daymet Version 4 | Environmental Sciences Division/Oak Ridge National Laboratory | Gridded observations | North America (land only) | 1 km x 1 km | 1980-2019 | Daily | NetCDF | details |
| PNWNAMET | PCIC | Gridded observations | North-western North America | 3.75 arc minutes (~6 km) | 1945-2012 | Daily | ASCII; NetCDF | details |
| Met1km | NRCan | Blend of gridded products | Canada | 1 km x 1 km | 1901–2017 | Daily | None | details |
| ERA5 | ECMWF | Global atmospheric reanalysis | Global | 0.25° x 0.25° | 1950 to present | Hourly; Daily; Monthly | GRIB;NetCDF | details |
| CFSR | NCEP | Global atmospheric reanalysis | Global | 0.5° x 0.5° | 1979-2017 | Sub-daily; Monthly | GRIB | details |
| MERRA-2 | NASA | Global atmospheric reanalysis | Global | ½° latitude x ⅝° longitude | 1980 to present | Hourly; Daily; Monthly | NetCDF | details |
| JRA-55 | JMA | Global atmospheric reanalysis | Global | 0.6258ᵒ x 0.6258ᵒ | 1957-2021 | 3h; 6h; Daily; Monthly | NetCDF | details |
| ASRv2 | Byrd Polar Research Center/The Ohio State University; UCAR/NCAR | Regional reanalysis | Arctic | 15 km x 15 km | 2000-2016 | 3h; Monthly | NetCDF | details |
| NARR | NCEP | Regional reanalysis | North America | 32 km x 32 km | 1979-2021 | Sub-daily; Monthly | GRIB | details |
| RDRSv2 | CCMEP/ECCC | Regional reanalysis | North America | 10 km x 10 km | 2000-2017(1980-1999 pending) | Hourly | RPN | details |
| 20CRv3 | CIRES; NOAA; DOE | Global atmospheric reanalysis | Global | T254 (approximately 75 km at the equator) | 20CRv3.SI is available for years 1836-1980 and 20CRv3.MO is available for years 1981-2015 | 3h; Daily; Monthly | NetCDF | details |
| ERA5-Land | ECMWF | Land surface reanalysis/model | Global (land only) | 0.1° x 0.1° (9 km) | 1950 to present | Hourly; Monthly | GRIB; NetCDF | details |
| AgERA | ECMWF | Re-gridded reanalysis | Global (land only) | 0.1° x 0.1° | 1979 to present | Daily | NetCDF | details |
| AgCFSR | NASA | Re-gridded reanalysis with corrections | Global (land only) | 0.25° × 0.25° | 1980-2010 | Daily | NetCDF | details |
| AgMERRA | NASA | Re-gridded reanalysis with corrections | Global (land only) | 0.25° × 0.25° | 1980-2010 | Daily | NetCDF | details |
| GMFD | Princeton University | Re-gridded reanalysis with corrections | Global (land only) | 0.25° × 0.25° | 1948-2016 | 3h; Daily; Monthly | NetCDF | details |
| CRU JRA | CRU/University of East Anglia | Re-gridded reanalysis with corrections | Global (land only) | 0.5° × 0.5° | 1901-2018 | 6h | NetCDF | details |
| S14FD | DIAS | Re-gridded reanalysis with corrections | Global | 0.5° x 0.5° | 1958-2013 | Daily | NetCDF | details |
The following summarizes the points that should be considered when a dataset is selected for historical climate analyses of 2 m temperature or climate indices computation in the Canadian North:
a) The best solution in describing 2 m air temperature local climate, trends and evolution over a long period of time in the Canadian North, is to use good quality homogenized data series from stations as provided in AHCCD: In-situ measurements, as those from MSC stations, represent the most reliable datasets. The AHCCD dataset (Vincent et al., 2020) was developed by ECCC to resolve some of issues with data inhomegeneity at stations. A detailed description of air temperature records from AHCCD is provided in Annex 7.1.5 and Vincent et al. 2020. AHCCD is also often used to validate the skill of gridded datasets, reanalyses and models in simulating local characteristics. A good practice in the evaluation of reanalyses and gridded products is to verify that the target dataset is independent of the evaluated product (the target stations are not incorporated into the product that is evaluated). Table 3.3 provides information on which datasets are assimilating or use MSC or AHCCD stations. Evaluation against a dataset with stations that were incorporated into the products does not assure that the evaluated product has the same skill outside those station locations.
b) AHCCD can be used for local statistical downscaling of models in locations where the dataset has a good temporal coverage (e.g., 20 years of data). Unfortunately, the AHCCD does not present data for all locations in the Canadian North, and different locations have different periods with data.
c) Despite their past use, the use of datasets obtained with gridding methods for regions of the Canadian North that feature a sparse network of stations should be approached cautiously. Only regional applications in areas with a good coverage of stations (e.g., a small watershed) and without large topographic variations could consider the use of a gridded-observation datasets. Several gridded-observation datasets are provided in Table 3.3 that could be used to fill the gap from stations. As mentioned in Section 2.1, the primary factors that influences the gridded products are the density of the stations incorporated in the product, and the topographic complexity of the region. For temperature, in the Canadian North special attention should be given to regions with important topography, as those regions are subject to important «semi-permanent» inversions, where temperature increases with height (e.g., the deep valleys of Yukon). This makes simple scaling by altitude (e.g., using a standard lapse rate or an adiabatic lapse rate) inappropriate. Figure 3.1 (Rapaić et al., 2015) shows the average spread between six gridded observations datasets (CANGRD, CRUTEM4, CRU-TS3.1, GISTEMP, HadCRUT3, and UDEL) for anomalies of winter mean temperature on a grid of approximately 50 km spatial resolution. The six datasets diverge largely over the mountain regions where the density of stations is reduced but are similar for the other regions. This result suggests that in regions with important topographic variations, a dataset produced using a method that incorporates elevation information and accounts for temperature inversions should be used. Table 3.3 includes three datasets obtained with different gridding methods that include elevation information in their methodologies: ANUSPLIN, PNWNAMET, and WorldClim2. It should be noted that ANUSPLIN’s thin-plate smoothing splines, which uses latitude, longitude and elevation as smoothing coordinates, does not represent discontinuities from cliffs and fault lines, which can affect extreme values, and does not account for temperature inversions. PNWNAMET is using the PRISM model, which takes into account temperature inversions from stations, but it is dependent on existence of stations at different elevations.
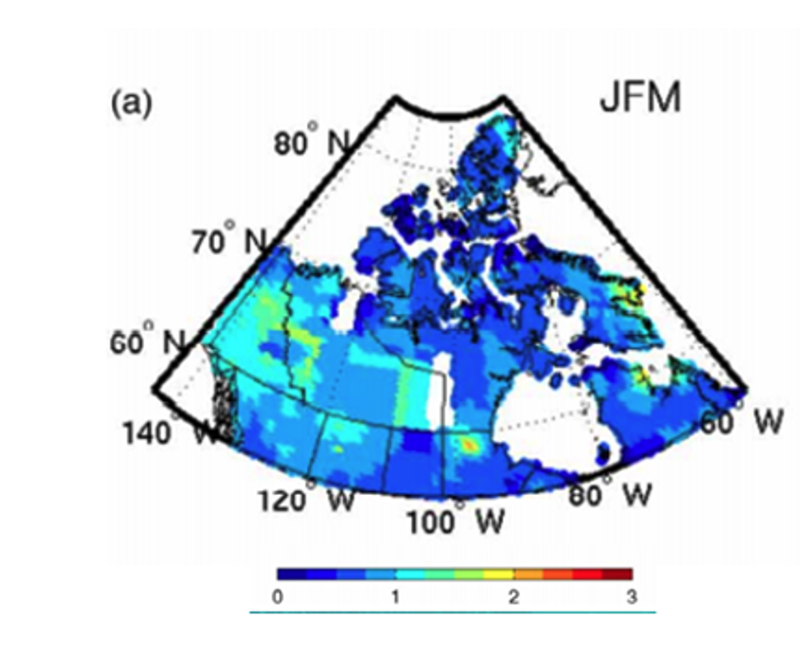
Figure 3.1 Average spread between six gridded observations datasets (CANGRD, CRUTEM4, CRU-TS3.1, GISTEMP, HadCRUT3, and UDEL) for anomalies of winter seasonal mean temperature on a grid of approximately 50 km spatial resolution. [Source: Rapaić et al., 2015]
d) Reforecasts and reanalyses represent a valuable alternative to gridded-observation datasets for applications that require 2 m air temperature data over large regions without good station records, for impact models, and for statistical downscaling and bias correction of climate models over large regions in the Canadian North. However, a rigorous evaluation focused only on Candian North is recommended first. Table 3.3 provide information about the last generation of global and regional reanalyses, most of them very recent versions. The statistical downscaling and bias correction of climate models is usually done against one dataset that is considered to represent the best the historical period at the spatial scale of interest. Presently, it is difficult to recommend one particular reanalysis for those applications over the Canadian North as many of the new datasets are not yet evaluated in a rigorous manner over this region. Some scientific papers focused on 2 m temperature over limited parts of the Canadian North (Cao et al., 2019; Diaconescu et al., 2018; Sheridan et al., 2020), the entire North America (Keller and Wahl, 2021; Tarek et al., 2020) or over the Arctic (Avila-Diaz et al., 2021; Lindsay et al., 2014; Przybylak and Wyszyński, 2020). As discussed in Section 2.1.3, the observations provide less of a constraint on reanalyses over the Canadian North compared to the Canadian South and the results of continental-scale evaluations could be biases by the much larger number of stations in regions outside the Canadian North. Broadly, however, 2 m temperature is one of the variables for which reanalyses have in general a good skill, especially over regions without important topographic features. For example, Avila-Diaz et al. (2021) compare ASRv2, NARR, ERA5, MERRA-2 and GMFD, over North American land north of 42-degree parallel, against the gridded data product Daymet and focuses on 9 temperature-based annual indices from Expert Team on Climate Change Detection and Indices (ETCCDI) over a 17-year period (2000–16). The paper shows that ASRv2, ERA5 and MERRA-2 are closer to Daymet, while NARR and GMFD have smaller scores for the northern regions (Arctic seaboard, Yukon River, Mackenzie River and Hudson Bay Seaboard – see Figure 4 from the paper). It should be noted that there is a limited number of station data that is used in the Daymet interpolation over the Arctic, that the analysis is focusing just on annual indices, and that ERA5 and NARR are assimilating 2 m temperature that partially could also be integrated in the Daymet product, which constitutes the validation data. As mentioned in Section 2.1.3, averaging multiple reanalyses could provide a better estimate of climate characteristics over the Canadian North than using a single one.
e) For local impact models, in regions without station data, the use of two or three reanalyses is also recommended. Those should be downscaled to the level of the location of interest. Local impact models need data at the local level. For example, permafrost occurrence and properties exhibit strong lateral variation over ranges of only a few metres to a few kilometres, due to the effects of topography, vegetation cover, ground material, water bodies and flow or snow distribution (Gruber, 2012). The local downscaling of reanalyses can be done using methods that take into account the elevation even for regions without stations. Cao et al., (2017) compared several downscaling methods that rely on physically based empirical–statistical relationships and do not require local station data. For regions with important temperature inversions, they recommend the use of REDCAPP method. The model uses as proxy of surface effects the difference between near-surface air temperature and pressure-level temperature from reanalyses. The method was validated over the Swiss Alps and the Qilian Mountains. It must be noted that a full simulation of the atmospheric physics and land surface at high resolution will likely outperform this parameterization used in the REDCAPP. However they are not freely available for use at any location. The REDCAPP method is written in Python, and it is available via GitHub (https://github.com/geocryology/REDCAPP).
References – Air temperature
Avila-Diaz, A., D.H. Bromwich, A.B. Wilson, F. Justino, and S. Wang, 2021: Climate Extremes across the North American Arctic in Modern Reanalyses. Journal of Climate, 34(7), 2385-2410, https://doi.org/10.1175/JCLI-D-20-0093.1.
Bromwich, D., Y.-H. Kuo, M. Serreze, J. Walsh, L.S. Bai, M. Barlage, K. Hines, and A. Slater, 2010: Arctic System Reanalysis: Call for community involvement. Eos, Transactions American Geophysical Union, 91(2), 13-14, https://doi.org/10.1029/2010EO020001.
Cao, B., S. Gruber, and T. Zhang, 2017: REDCAPP (v1.0): parameterizing valley inversions in air temperature data downscaled from reanalyses. Geoscientific Model Development, 10(8), 2905-2923. https://doi.org/10.5194/gmd-10-2905-2017.
Cao, B., X. Quan , N. Brown, E. Stewart-Jone, and S. Gruber, 2019: GlobSim (v1.0): deriving meteorological time series for point locations from multiple global reanalyses. Geoscientific Model Development, 12(11), 4661-4679, https://doi.org/10.5194/gmd-12-4661-2019.
Compo, G.P., J.S. Whitaker, P.D. Sardeshmukh, N. Matsui, R.J. Allan, X. Yin, B.E. Gleason, R.S. Vose, G. Rutledge, P. Bessemoulin, S. Brönnimann, M. Brunet, R.I. Crouthamel, A.N. Grant, P.Y. Groisman, P.D. Jones, M. Kruk, A.C. Kruger, G.J. Marshall, M. Maugeri, H.Y. Mok, Ø. Nordli, T.F. Ross, R.M. Trigo, X.L. Wang, S.D. Woodruff, and S.J. Worley, 2011: The Twentieth Century Reanalysis Project. Quarterly Journal of the Royal Meteorological Society, 137(654), 1-28, DOI: 10.1002/qj.776.
Diaconescu, E.P., A. Mailhot, R. Brown, and D. Chaumont, 2018: Evaluation of CORDEX-Arctic daily precipitation and temperature based climate indices over Canadian Arctic land areas. Climate Dynamics, 50(5), 2061-2085 , doi:10.1007/s00382-017-3736-4.
Fick, S.E., and R.J Hijmans, 2017: WorldClim 2: New 1 km spatial resolution climate surfaces for global land areas. International journal of climatology, 37(12), 4302-4315, https://doi.org/10.1002/joc.5086.
Gasset, N., V. Fortin, M. Dimitrijevic, M. Carrera, B. Bilodeau, R. Muncaster, É.,Gaborit, G. Roy, N. Pentcheva, M. Bulat, X. Wang, R. Pavlovic, F. Lespinas, and D. Khedhaouiria, 2021: A 10 km North American Precipitation and Land Surface Reanalysis Based on the GEM Atmospheric Model. Hydrology and Earth System Sciences, 25(9), 4917-4945, https://doi.org/10.5194/hess-25-4917-2021.
Gelaro, R., W. McCarty, M.J. Suárez, R. Todling, A. Molod, L. Takacs, C.A. Randles, A. Darmenov, M.G. Bosilovich, R. Reichle, K. Wargan, L. Coy, R. Cullather, C. Draper, S. Akella, V. Buchard, A. Conaty, A.M. da Silva, W. Gu, G. Kim, R. Koster, R., Lucchesi, D. Merkova, J. E. Nielsen, G. Partyka, S. Pawson, W. Putman, M. Rienecker, S. D. Schubert, M. Sienkiewicz, and B. Zhao, 2017: The Modern-Era Retrospective Analysis for Research and Applications, Version 2 (MERRA-2). Journal of Climate, 30(14), 5419-5454, doi: 10.1175/JCLI-D-16-0758.1.
Gruber, S., 2012: Derivation and analysis of a high-resolution estimate of global permafrost zonation. The Cryosphere, 6(1), 221–233, www.the-cryosphere.net/6/221/2012/doi:10.5194/tc-6-221-201.
Harris, I., T.J. Osborn, P. Jones, and D. Lister, 2020: Version 4 of the CRU TS monthly high-resolution gridded multivariate climate dataset. Scientific data, 7(1), 1-18 , https://doi.org/10.1038/s41597-020-0453-3.
Hersbach, H., B .Bell, P. Berrisford, S. Hirahara, A. Horányi, J. Muñoz‐Sabater, J. Nicolas, C. Peubey, R. Radu, D. Schepers, A. Simmons, C. Soci, S. Abdalla, X. Abellan, G. Balsamo, P. Bechtold, G. Biavati, J. Bidlot, M. Bonavita, G. Chiara, P. Dahlgren, D. Dee, M. Diamantakis, R. Dragani, J. Flemming, R. Forbes, M. Fuentes, A. Geer, L. Haimberger, S. Healy, R.J. Hogan, E. Hólm, M. Janisková, S. Keeley, P. Laloyaux, P. Lopez, C. Lupu, G. Radnoti, P. Rosnay, I. Rozum, F. Vamborg, S. Villaume, and J.-N. Thépaut, 2020: The ERA5 global reanalysis. Quarterly Journal of the Royal Meteorological Society, 146(730), 1999–2049. https://doi.org/10.1002/qj.3803.
Iizumi, T., H. Takikawa, Y. Hirabayashi, N.Hanasaki, and M. Nishimori, 2017. Contributions of different bias-correction methods and reference meteorological forcing data sets to uncertainty in projected temperature and precipitation extremes. Journal of Geophysical Research: Atmospheres, 122(15), 7800-7819, doi: 10.1002/2017JD026613.
Keller, J. D., and W. Sabrina, 2021: Representation of Climate in Reanalyses: An Intercomparison for Europe and North America. Journal of Climate, 34(5), 1667-1684, https://doi.org/10.1175/JCLI-D-20-0609.1.
Kobayashi, S., Y. Ota, Y. Harada, A. Ebita, M. Moriya, H. Onoda, K. Onogi, H. Kamahori, C. Kobayashi, H. Endo, K. Miyaoka, and K. Takahashi, 2015: The JRA-55 Reanalysis: General specifications and basic characteristics. Journal of the Meteorological Society of Japan. Ser. II, 93(1), 5-48, doi:10.2151/jmsj.2015-001.
Lindsay, R., M. Wensnahan, A. Schweiger, and J. Zhang, 2014: Evaluation of seven different atmospheric reanalysis products in the Arctic. J. Climate, 27, 2588–2606, doi:10.1175/JCLI-D-13-00014.1.
MacDonald, H., D.W. McKenney, P. Papadopol, K. Lawrence, J. Pedlar, and M. F. Hutchinson, 2020: North American historical monthly spatial climate dataset, 1901–2016. Scientific Data, 7(1), 1-11, https://doi.org/10.1038/s41597-020-00737-2.
Mekis, E., N. Donaldson, J. Reid, J. Hoover, A. Zucconi, Q. Li, R. Nitu, and S. Melo, 2018: An Overview of the Surface-Based Precipitation Observations at Environment and Climate Change Canada, Atmosphere-Ocean, 56(2), 71-95, https://doi.org/10.1080/07055900.2018.1433627.
Mesinger, F., G. DiMego, E. Kalnay, K. Mitchell, P.C. Shafran, W. Ebisuzaki, D. Jović, J. Woollen, E. Rogers, E.H. Berbery, M.B. Ek, Y. Fan, R. Grumbine, W. Higgins, H. Li, Y. Lin, G. Manikin, D. Parrish, and W. Shi, 2006: North American Regional Reanalysis. Bulletin of the American Meteorological Society, 87(3), 343-360, doi:10.1175/BAMS-87-3-343.
Muñoz-Sabater, J., E. Dutra, A. Agustí-Panareda, C. Albergel, G. Arduini, G., Balsamo, S. Boussetta, M. Choulga, S. Harrigan, H. Hersbach, B. Martens, D. G. Miralles, M. Piles, N. J. Rodríguez-Fernández, E. Zsoter, C. Buontempo, and J.-N. Thépaut, 2021: ERA5-Land: A state-of-the-art global reanalysis dataset for land applications. Earth System Science Data, 13(9), 4349-4383. https://doi.org/10.5194/essd-2021-82.
Przybylak, R., and P. Wyszyński, 2020: Air temperature changes in the Arctic in the period 1951–2015 in the light of observational and reanalysis data. Theoretical and Applied Climatology, 139(1), 75-94, https://doi.org/10.1007/s00704-019-02952-3.
Rapaić, M., R. Brown, M. Markovic, D. Chaumont, 2015: An evaluation of temperature and precipitation surface-based and reanalysis datasets for the Canadian Arctic, 1950–2010. Atmosphere-Ocean 53(3): 283–303. https://doi.org/10.1080/07055900.2015.1045825.
Ruane, A.C., R. Goldberg, and J. Chryssanthacopoulos, 2015: AgMIP climate forcing datasets for agricultural modelling: Merged products for gap-filling and historical climate series estimation, Agr. Forest Meteorol., 200, 233-248, doi:10.1016/j.agrformet.2014.09.016.
Saha, S., S. Moorthi, X. Wu, J. Wang, S. Nadiga, P. Tripp, D. Behringer, Y. Hou, H. Chuang, M. Iredell, M.Ek, J. Meng, R. Yang, M.P. Mendez, H. van den Dool, Q. Zhang, W. Wang, M. Chen, and E. Becker, 2014: The NCEP Climate Forecast System Version 2, Journal of Climate, 27(6), 2185-2208, doi:10.1175/JCLI-D-12-00823.1.
Sheffield, J., G. Goteti, and E.F. Wood, 2006: Development of a 50-Year High-Resolution Global Dataset of Meteorological Forcings for Land Surface Modeling. Journal of Climate 19, 13, 3088-3111, https://doi.org/10.1175/JCLI3790.1.
Sheridan, S.C., C.C. Lee, and E.T. Smith, 2020: A Comparison Between Station Observations and Reanalysis Data in the Identification of Extreme Temperature Events. Geophys. Res. Lett., 47, https://doi.org/10.1029/2020gl088120.
Tang, G., M.P. Clark, A.J. Newman, A.W. Wood, S.M. Papalexiou, V. Vionnet, and P.H. Whitfield, 2020: SCDNA: a serially complete precipitation and temperature dataset for North America from 1979 to 2018. Earth Syst. Sci. Data, 12, 2381–2409, https://doi.org/10.5194/essd-12-2381-2020.
Tarek, M., F.P. Brissette, and R. Arsenault, 2020: Evaluation of the ERA5 reanalysis as a potential reference dataset for hydrological modelling over North America. Hydrol. Earth Syst. Sci., 24, 2527–2544, https://doi.org/10.5194/hess-24-2527-2020.
Thornton, M.M., R. Shrestha, Y. Wei, P.E. Thornton, S. Kao, and B.E. Wilson, 2020: Daymet: Daily Surface Weather Data on a 1 km Grid for North America, Version 4. ORNL DAAC, Oak Ridge, Tennessee, USA. https://doi.org/10.3334/ORNLDAAC/1840.
Vincent, L.A., M.M. Hartwell, and W.L. Wang, 2020: A Third Generation of Homogenized Temperature for Trend Analysis and Monitoring Changes in Canada’s Climate. Atmosphere-Ocean, 58(3), 173-191. https://doi.org/10.1080/07055900.2020.1765728.
Werner, A.T., M.A. Schnorbus, R.R. Shrestha, A.J. Cannon, F.W. Zwiers, G. Dayon G., and F. Anslow, 2019: A long-term, temporally consistent, gridded daily meteorological dataset for northwestern North America, Scientific Data, 6, 180299, doi:10.1038/sdata.2018.299.
Zhang, Y., B. Qian, and G. Hong, 2020: A Long-Term, 1 km Resolution Daily Meteorological Dataset for Modeling and Mapping Permafrost in Canada. Atmosphere 2020, 11, 1363. https://doi.org/10.3390/atmos11121363.