Lead Author: Alex Crawford (University of Manitoba)
Contributors: Stephen Howell (CRD/ECCC), Jennifer Lukovich (University of Manitoba)
As with snow variables, the common practice in simulating sea ice variables over historical period and for creating climate future projections is to use ensembles of physical climate models CMIP5 and CMIP6. In these models, sea ice is simulated within discrete cells of a sea ice model component that is coupled to an atmospheric model and ocean model. Growth and melt of sea ice are driven by heat exchange with the atmosphere and ocean. Sea ice cover can also change by divergence and convergence, which are driven by wind in the atmosphere and currents and waves in the ocean. ‘Coupling’ of model components means that sea ice can in turn influence the ocean and atmosphere (e.g., higher sea ice concentration means a higher reflectivity and less solar radiation input to the surface).
The amount of data available from CMIP5 (https://esgf-node.llnl.gov/search/cmip5/) and CMIP6 (https://esgf-node.llnl.gov/search/cmip6/) is vast because, in addition to the calculation of multiple sea ice variables from multiple experiments, each modelling group may produce more than one model version, and each model version may be run multiple times for the same experiment (as a measure of model internal variability). Many modelling groups release ocean and sea ice data on variable-resolution grids and/or rotated grids (e.g., with the “north pole” shifted to over Greenland), so spatial resolution is not easily compared. The average cell size per model in CMIP5 and CMIP6 ranges from roughly 25 km to roughly 250 km, with finer resolution more common in CMIP6. Sea ice characteristics are available as monthly averages, which some models providing sea ice concentration, thickness, and velocity as daily averages, as well.
The narrow channels in Canadian Arctic waters are not well represented by the coarse spatial resolution GCMs and the uncertainty in model projections is higher for the Canadian Arctic Archipelago than for the pan-Arctic. In spite of this, the CMIP5/6 multi-model ensemble still provides a quantitative basis for projecting future sea ice conditions for applications in the Canadian North.
The primary application of these coarse resolution, long-term simulations is to make projections about the possible uses and routes for human activities in the Arctic throughout the 21st century and beyond. Shipping lanes into Hudson Bay and through the Canadian Arctic Archipelago (the Northwest Passage) will continue to become more accessible as sea ice cover declines, and CMIP5/6 models allow us to estimate how long these routes will be open in the future (e.g., Smith and Stephenson, 2013; Melia et al., 2017; Andrews et al., 2018). For example, CMIP5 models showed that nearly ice-free summers are very likely with 2.0°C of global warming above pre-industrial levels but unlikely if global warming is limited to 1.5°C (Jahn, 2018; Sigmond et al., 2018). For areas with seasonal sea ice cover, the length of the ice-free season expands by about 1 month with each additional 1°C of global warming in CMIP6 models (Crawford et al., 2021). This translates to opening of the Northwest Passage and Hudson Bay to all vessels for at least part of the year with 2°C of global warming above pre-industrial levels (Mudryk et al., 2021).
CMIP5
In CMIP5, monthly sea ice concentration is available from up to 41 models (16 modelling groups), depending on the experiment. Daily sea ice concentration is available from up to 32 models (16 modelling groups). Sea ice thickness and motion are also available for most but not all those models. Sea ice motion is reported as a velocity for daily data and a volume transport for monthly data. In both cases, motion is divided into an x-component and y-component based on the model’s ocean grid (so they are not necessarily zonal and meridional). Historical experiment simulations run 1850-2005. For these, solar variability, atmospheric composition (including aerosols), and land use are prescribed to the models to reproduce observed climate forcings. Future projections include four “representative concentration pathways” (RCPs), each of which has a different timeline of atmospheric composition and land use change. In RCP2.6, radiative forcing peaks at ~2.6 W m-2 near 2100 before declining. In RCP4.5 and RCP6.0, radiative forcing stabilizes after 2100 at ~4.5 W m-2 and ~6.0 W m-2, respectively. In RCP8.5, radiative forcing reaches ~8.5 W m-2 near 2100 but may continue rising. All RCP simulations are run from 2006-2100, with some extended through 2300. Table 3.4 shows the total number of simulations available for each experiment and temporal resolution.
Table 3.4 Number of CMIP5 simulations with available sea ice data for each combination of temporal resolution and experiment (as of Sep 2021).
| Property (variable) | Historical | RCP2.6 | RCP4.5 | RCP6.0 | RCP8.5 | |
|---|---|---|---|---|---|---|
| Daily | Concentration (sic) | 116 | 32 | 63 | 16 | 52 |
| Thickness (sit) | 106 | 32 | 57 | 16 | 48 | |
| Motion (usi, vsi) | 75 | 30 | 54 | 15 | 41 | |
| Monthly | Concentration (sic) | 195 | 56 | 146 | 36 | 63 |
| Thickness (sit) | 195 | 56 | 146 | 36 | 63 | |
| Motion (transix, transiy) | 134 | 40 | 88 | 31 | 86 |
CMIP6
Although some sea ice models were modified between CMIP5 and CMIP6 (e.g, Bailey et al., 2020), the biggest difference between these CMIPs is the larger volume of data available from CMIP6. As of September 2021, available CMIP6 data include simulations of monthly sea ice concentration from up to 57 models (29 modelling groups) and daily sea ice concentration data from up to 40 models (21 modelling groups). Compared to CMIP5, the number of historical simulations more than doubled for daily data and nearly tripled for monthly data (Table 3.5). As with CMIP5, most models also produce output for sea ice thickness and motion, but motion is always reported as a velocity (available as an x-component (siu) and y-component (siv)). Several modelling groups have also released additional variables (e.g., frazil ice growth versus basal growth) to better diagnose model processes and biases (Notz et al., 2016; Keen et al., 2021). Historical experiments for CMIP6 run from 1850-2014. For future projections (2015-2100 or 2015-2300), radiative forcing targets (like those of CMIP5) were combined with “shared socioeconomic pathways” (SSPs), which account for the possibility that a single policy framework may yield different emissions and land use change, and therefore different radiative forcings.
Table 3.5 Number of CMIP6 simulations with available sea ice data for each combination of temporal resolution and experiment (as of Sep 2021).
| Property (variable) | Historical | SSP1 1.9 |
SSP1 2.6 |
SSP4 3.4 |
SSP2 4.5 |
SSP4 6.0 |
SSP3 7.0 |
SSP5 8.5 |
|
|---|---|---|---|---|---|---|---|---|---|
| Daily | Concentration (siconc) | 289 | 76 | 89 | 7 | 206 | 15 | 105 | 91 |
| Thickness (sithick) | 252 | 19 | 51 | 2 | 139 | 10 | 68 | 53 | |
| Motion (siu, siv) | 271 | 69 | 69 | 7 | 158 | 15 | 87 | 72 | |
| Monthly | Concentration (siconc) | 590 | 151 | 303 | 9 | 414 | 67 | 280 | 285 |
| Thickness (sithick) | 526 | 55 | 225 | 10 | 339 | 18 | 208 | 207 | |
| Motion (siu, siv) | 552 | 156 | 313 | 15 | 378 | 73 | 297 | 247 |
Considerations and Limitations
As for the other climate variables, differences amongst historical CMIP5/6 simulations of sea ice variables arise from different model biases and internal climate variability, and a multi-model ensemble of multiple simulations from each model must be used. However, each model submitted to CMIP5/6 has a different number of simulations. As for the other variables, to provide equal weight for each model when calculating multi-model means for sea-ice variables, it is common to select just one simulation from each model.
Errors in the boundary conditions with which the models are forced and biases in the observations can also contribute to differences between observations and historical simulations. Several studies making projections of Arctic sea ice properties into the 21st century use only a subset of CMIP models that best match some historical metric, such as the historical average or trend in September sea ice extent (e.g., Wang and Overland, 2012; Mioduszewski et al., 2019; Peng et al., 2020). However, discarding models in this way risks introducing more bias Internal variability in Arctic sea ice characteristics is often the largest source of model uncertainty (Notz, 2014, Bonan et al., 2021), and the impact of internal variability on recent Arctic sea ice loss has been nonuniform for both region and season (England et al., 2019). By using a smaller number of members, the ensemble does not sample enough the model uncertainty. Additionally, the models that best match observed trends in Arctic sea ice loss are often correct for the wrong reason, such as combining sea ice sensitivity to warming that is too weak with global warming that is too strong (Rosenblum and Eisenman, 2017). Therefore, success in projecting past sea ice conditions does not provide a substantial reduction to uncertainty in future projections (Laliberté et al., 2015).
Moreover, because many modelling groups share code for certain processes, individual models are not truly independent (Annan and Hargreaves, 2017), which may also bias the ensemble based on a single simulation from each CMIP5/6 model. A more sophisticated approach that attempts to address this issue is to keep all model simulations when making projections but weight them based on a) their ability to match observations of Arctic sea ice and temperature characteristics and b) their degree of dependence (Knutti et al., 2017). Diagnostics chosen for weighting should have a physical justification, such as being an emergent constraint on projected sea ice characteristics (Massonnet et al., 2012; Knutti et al., 2017). Differential weighting balances the shortcomings of other approaches, but it also requires greater computational power and potentially more data storage space for diagnostic variables.
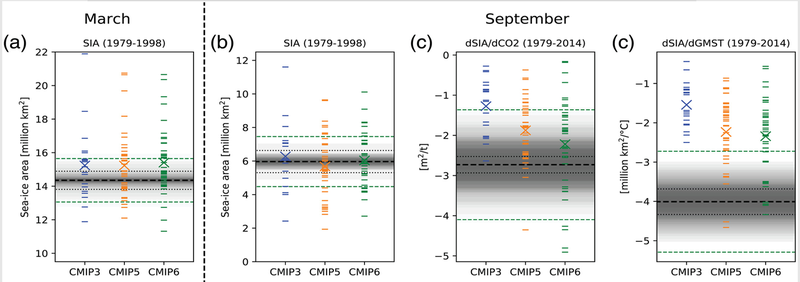
Figure 4.9: (a,b) Comparison of sea-ice area (SIA) in CMIP3, CMIP5, and CMIP6 simulations to the passive microwave record in (a) March 1979-1998 and (b) September 1979-1998. (c) Comparison over 1979-2014 of the sensitivity of the trend in September sea-ice area to the trend in (left) CO2 emissions and (right) global mean surface temperature (GMST). Each dash indicates the value for the first ensemble member of each model, and the x’s indicate the multi-model mean. The thick black dashed line is the average of three satellite products, and the dotted lines indicate 1 standard deviation of observational uncertainty. Internal variability is calculated as the ensemble standard deviation for any model with at least 3 ensemble members and plotted as overlying gray shading. The green dashed lines show an overall “plausible range” for each property based on both observational uncertainty and internal variability. [Source: SIMIP Community (2020)].
Figure 4.9 summarizes the skill of CMIP3, CMIP5 and CMI6 in simulating sea ice area over the historical period. The March multi-model mean sea-ice area for 1979-1998 CMIP5 and CMIP6 is higher than the observational mean but within a plausible range once observational uncertainty and internal variability are accounted for (Figure 1; SIMIP Community 2020). In September, the multi-model means match observations well. CMIP5 models tend to underestimate the historical downward trend in September sea ice (Stroeve et al., 2012; Wang and Overland, 2012) because they underestimate the sensitivity of sea-ice area to global warming (Figure 1c). The trends in CMIP6 models have better alignment with observations (Shu et al., 2020), but this does not represent a major improvement to the sea ice model components. Rather, the CMIP6 multi-model mean demonstrates greater sensitivity of temperature to CO2 emissions than does CMIP5 but has the same bias in the sensitivity of sea-ice area to temperature (SIMIP Community 2020, Fyfe et al., 2021). Therefore, CMIP6 represents only slight improvement over CMIP5, and any projections of future sea ice change using either CMIP must be considered with the caveat that the rate of change is likely underestimated.
Biases in CMIP simulations vary significantly by region and by season (Crawford et al., 2021; Watts et al., 2021). For example, the number of days with sea ice cover is overestimated in Hudson Bay by almost every CMIP6 model, but this parameter is well estimated in the Central Arctic Ocean. In the Beaufort Sea, the August retreat of sea ice below 15% concentration is better aligned between CMIP6 simulations and observations than the October advance above 15% concentration (Crawford et al., 2021). Problematically, biases are often opposite in different seasons or regions and so compensate for each other (Smith et al., 2020, Crawford et al., 2021; Watts et al., 2021). Therefore, it is common for pan-Arctic annual metrics to exhibit less bias than regional or seasonal metrics.
Fewer validation studies have been conducted for simulated sea ice thickness and sea ice motion. About half of the CMIP6 models examined by Watts et al. (2021) produced spatial patterns of sea ice thickness that matched results from the PIOMAS reanalysis (1979-2014). Pattern correlations were lower but still positive and significant when compared to CryoSat-2 (2011-2014). Sea ice volume, which depends on both sea-ice extent and thickness, has smaller biases in CMIP6 than CMIP5 when compared to PIOMAS, as well as a smaller model spread (Davy and Outten, 2020). This improvement results in part from thicker (and therefore more accurate) sea ice in Hudson Bay and north of the Canadian Arctic Archipelago in CMIP6. An assessment of sea ice drift from CMIP5 models demonstrated their ability to capture the observed increasing trend in sea ice drift speed in winter associated with an increasingly thinner sea ice cover (Tandon et al., 2018). Observed increasing trends in summer are, however, not captured by CMIP5 models, which the authors attribute to what is referred to as a sea ice extent effect associated with a transition to a partial ice cover, with implications for ice-ice and ice-coast interactions captured by deformation.
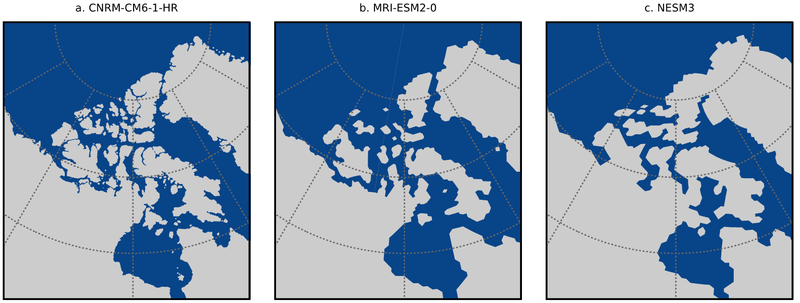
Figure 4.10: Example of land/ocean masks used in three CMIP6 models selected to show the range of detail resolved. Gray represents land and blue represents ocean (and therefore the grid cells capable of having sea ice cover).
The coarse resolution of CMIP5/6 models (Figure 4.10) limits their ability to capture local-scale sea-ice processes. The complexity of Canadian Arctic Archipelago is severely reduced in all but the highest-resolution models. For example, CNRM-CM6-1-HR (Figure 4.10a; nominal resolution of 25 km) resolves the Belcher Islands, differentiates Axel Heiberg from Ellesmere Island, and differentiates Bylot Island from Baffin Island. However, neither MRI-ESM2-0 or NESM3 (nominal resolution of 100 km) are so precise. MRI-ESM2-0 preserves water bodies while shrinking or eliminating land masses (e.g., Southampton Island, Devon Island). NESM3 expands and combines islands together while eliminating many straits (e.g., Victoria Strait and Nares Strait). Dynamically downscaled model output may therefore improve accuracy, but there are currently too few examples of dynamically downscaled sea ice data for proper assessment. For example, sea ice concentration is available for the 25-km North America CORDEX domain from only one model.
Although some CMIP5 models provide reasonable estimates of landfast ice thickness in the Canadian Arctic Archipelago compared to observations, many simulate landfast ice that is too thick and downward trends are excessively strong (Howell et al., 2016). Additionally, only models that provide a good match to historical observations of landfast ice thickness typically maintain seasonal landfast ice throughout the 21st century, showing that overall projections of sea ice extent are sensitive to the representation of landfast ice in CMIP simulations (Laliberté et al., 2018).
References - Sea Ice:
Andrews, J., D. Babb, and D.G. Barber, 2018: Climate change and sea ice: Shipping in Hudson Bay, Hudson Strait, and Foxe Basin (1980–2016). Elementa: Science of the Anthropocene, 6, https://doi.org/10.1525/journal.elementa.281.
Annan, J.D., and J.C. Hargreaves, 2017: On the meaning of independence in climate science. Earth System Dynamics, 8(1), 211-224, https://doi.org/10.5194/esd-8-211-2017.
Bailey, D.A., M.M. Holland, A.K. DuVivier, E.C. Hunke, and A.K. Turner, 2020: Impact of a New Sea Ice Thermodynamic Formulation in the CESM2 Sea Ice Component. Journal of Advances in Modeling Earth Systems, 12(11), e2020MS002154, https://doi.org/10.1029/2020ms002154.
Bonan, D., F. Lehner, and M. Holland, 2021: Partitioning uncertainty in projections of Arctic sea ice, Environmental Research Letters, 16(4), 044002.
Crawford, A., J. Stroeve, A. Smith, and A. Jahn, 2021: Arctic open-water periods are projected to lengthen dramatically by 2100. Communications Earth & Environment, 2(1), 1-10, https://doi.org/10.1038/s43247-021-00183-x.
Davy, R., and S. Outten, 2020: The Arctic Surface Climate in CMIP6: Status and Developments since CMIP5. Journal of Climate, 33(18), 8047-8068., https://doi.org/10.1175/jcli-d-19-0990.1.
England, M., A. Jahn, and L. Polvani, 2019: Nonuniform Contribution of Internal Variability to Recent Arctic Sea Ice Loss. Journal of Climate, 32(13), 4039–4053, https://doi.org/10.1175/jcli-d-18-0864.1.
Fyfe, J.C., V.V. Kharin, B.D. Santer, J.N. S. Cole, and N.P. Gillett, 2021: Significant impact of forcing uncertainty in a large ensemble of climate model simulations, Proceedings of the National Academy of Sciences, 118 (23) e2016549118; DOI: 10.1073/pnas.2016549118.
Howell, S.E. L., F. Laliberté, R. Kwok, C. Derksen, and J. King, 2016: Landfast ice thickness in the Canadian Arctic Archipelago from observations and models. Cryosphere, 10(4), 1463–1475, https://doi.org/10.5194/tc-10-1463-2016.
Jahn, A., 2018: Reduced probability of ice-free summers for 1.5 °C compared to 2 °C warming. Nature Climate Change, 8(5), 409–413, https://doi.org/10.1038/s41558-018-0127-8.
Keen, A., E. Blockley, D.A. Bailey, J.B. Debernard, M. Bushuk, S. Delhaye, D. Docquier, D. Feltham, F. Massonnet, S. O'Farrell, L. Ponsoni, J.M. Rodriguez, D. Schroeder, N. Swart, T. Toyoda, H. Tsujino, M. Vancoppenolle, and K. Wyserand, 2020: An inter-comparison of the mass budget of the Arctic sea ice in CMIP6 models. Cryosphere, 15(2), 951–982, https://doi.org/10.5194/tc-15-951-2021.
Laliberté, F., S.E.L. Howell, and P.J. Kushner, 2016: Regional variability of a projected sea ice‐free Arctic during the summer months. Geophysical Research Letters, 43(1), 256–263, https://doi.org/10.1002/2015gl066855.
Laliberté, F., S.E.L. Howell, J.-F. Lemieux, F. Dupont, and J. Lei, 2018: What historical landfast ice observations tell us about projected ice conditions in Arctic archipelagoes and marginal seas under anthropogenic forcing. Cryosphere, 12(11), 3577–3588, https://doi.org/10.5194/tc-12-3577-2018.
Massonnet, F., T. Fichefet, H. Goosse, C.M. Bitz, G. Philippon-Berthier, M.M. Holland, and P.-Y. Barriat, 2012: Constraining projections of summer Arctic sea ice. Cryosphere, 6(6), 1383–1394, https://doi.org/10.5194/tc-6-1383-2012.
Melia, N., K. Haines, E. Hawkins, and J.J. Day, 2017: Towards seasonal Arctic shipping route predictions. Environmental Research Letters, 12(8), 084005, https://doi.org/10.1088/1748-9326/aa7a60.
Mioduszewski, J.R., S. Vavrus, M. Wang, M.M. Holland, and L. Landrum, 2019: Past and future interannual variability in Arctic sea ice in coupled climate models. The Cryosphere, 13(1), 113–124, https://doi.org/10.5194/tc-13-113-2019.
Mudryk, L.R., J. Dawson, S.E.L. Howell, C. Derksen, T.A. Zagon, and M. Brady, 2021: Impact of 1, 2 and 4 °C of global warming on ship navigation in the Canadian Arctic. Nat Clim Change, 11(8), 673–679, https://doi.org/10.1038/s41558-021-01087-6.
Notz, D., 2014: Sea-ice extent and its trend provide limited metrics of model performance. The Cryosphere, 8(1), 229–243, https://doi.org/10.5194/tc-8-229-2014.
Notz, D., A. Jahn, M.M. Holland, E. Hunke, F. Massonnet, J. Stroeve, B. Tremblay, and M. Vancoppenolle, 2016: The CMIP6 Sea-Ice Model Intercomparison Project (SIMIP): Understanding sea ice through climate-model simulations. Geoscientific Model Development, 9(9), 3427–3446. https://doi.org/10.5194/gmd-9-3427-2016.
Peng, G., J.L., M. Matthews, R. Wang, L. Vose, and L. Sun, 2020: What Do Global Climate Models Tell Us about Future Arctic Sea Ice Coverage Changes? Clim, 8, 15, https://doi.org/10.3390/cli8010015.
Rosenblum, E., and I. Eisenman, 2017: Sea Ice Trends in Climate Models Only Accurate in Runs with Biased Global Warming. Journal of Climate, 30, 6265–6278, https://doi.org/10.1175/jcli-d-16-0455.1.
Shu, Q., Q. Wang, Z. Song, F. Qiao, J. Zhao, M. Chu, and X. Li, 2020: Assessment of Sea Ice Extent in CMIP6 With Comparison to Observations and CMIP5. Geophys Res Lett, 47, https://doi.org/10.1029/2020gl087965.
Sigmond, M., J.C. Fyfe, and N.C. Swart, 2018: Ice-free Arctic projections under the Paris Agreement. Nat Clim Change, 8, 404–408, https://doi.org/10.1038/s41558-018-0124-y.
SIMIP Community, 2020: Arctic Sea Ice in CMIP6. Geophysical Research Letters, 47(10), e2019GL086749, https://doi.org/10.1029/2019gl086749.
Smith, A., A. Jahn, and M. Wang, 2020: Seasonal transition dates can reveal biases in Arctic sea ice simulations. Cryosphere, 14(9), 2977–2997, https://doi.org/10.5194/tc-14-2977-2020.
Smith, L.C., and S.R. Stephenson, 2013: New Trans-Arctic shipping routes navigable by mid-century. Proceedings of the National Academy of Sciences, 110(13), E1191-E1195, https://doi.org/10.1073/pnas.1214212110.
Stroeve, J.C., V. Kattsov, A. Barrett, M.C. Serreze, T. Pavlova, M.M. Holland, and W.N. Meier, 2012: Trends in Arctic sea ice extent from CMIP5, CMIP3 and observations. Geophysical Research Letters, 39(16), L16502, https://doi.org/10.1029/2012gl052676.
Tandon, N.F., P.J. Kushner, D. Docquier, J.J. Wettstein, and C. Li., 2018. Reassessing Sea Ice Drift and Its Relationship to Long‐Term Arctic Sea Ice Loss in Coupled Climate Models. Journal of Geophysical Research: Oceans 123(6), 4338–4359, doi:10.1029/2017jc013697.
Wang, M., and J.E. Overland, 2012: A sea ice free summer Arctic within 30 years: An update from CMIP5 models. Geophys Res Lett, 39(18), https://doi.org/10.1029/2012gl052868.
Watts, M., W. Maslowski, Y.J. Lee, J.C. Kinney, and R. Osinski, 2021: A spatial evaluation of Arctic sea ice and regional limitations in CMIP6 historical simulations. Journal of Climate, 34(15), 6399-6420, https://doi.org/10.1175/jcli-d-20-0491.1.