Lead Authors: Emilia Diaconescu (CCCS/ECCC) and Elaine Barrow (CCCS/ECCC)
Historical evolution and future projections of meteorological variables are obtained as output from the atmospheric part of a climate model. Temperature is one of the prognostic variables (variables that a computer model estimates directly from physical equations) and there is high confidence in its estimation in models, since it is directly related to the radiation balance. Some systematic biases exist, however, since it is impossible to develop a perfect climate model. Precipitation, specific and relative humidity, and wind are variables in which we have lower confidence than we do for temperature (Cannon et al., 2020). The simulation of precipitation depends strongly on parameterized processes, such as convection and clouds, used in the atmospheric model. Consequently, the biases in precipitation are generally larger than those for temperature. Analysis of model performance over the historical period is an important step in identifying those biases and choosing the appropriate method for constructing climate projections.
Table 4.1 provides information on the latest available climate projections for Canada, that adopt the multi-model approach and cover a range of emissions scenarios (from “low” or “moderate” to “high”), in recognition that no single climate change scenario can adequately capture the range of possible climate futures. Projections for the meteorological variables from those ensembles can be used to answer climate adaptation questions.
Considerations and limitations:
a) CMIP5 and CMIP6 ensembles
CMIP ensembles provide large-scale climate projections for a large spectrum of climate variables, including meteorological variables. However, because the data have a coarse resolution, they are often used just for a high-level and thematic understanding of climatic changes and for identifying the key vulnerabilities and risks at provincial levels (average values over large area). In order to address the issue of systematic biases from models, most studies based on CMIP raw data present maps of changes with respect to a historical reference period, or the time evolution of anomalies of the spatial mean over the large areas of interest. Canada’s Changing Climate Report (Bush and Lemmen, 2019) summarizes information from CMIP5 models, based on RCP2.6, RCP4.5, and RCP8.5, for temperature and precipitation across Canada. The average changes for the Canadian North (ensemble median and 25th-75th percentiles) are provided in tables and maps. Although, CMIP5 and CMIP6 data are available for download for other meteorological variables, such as wind speeds and humidity, the report does not offer information for these variables for Canada because of limited research on the mechanisms and causes of changes in those variables.
The ensemble presented in the report consists of 29 GCM simulations, with a single run per GCM, with each run having equal weighting. How to construct an ensemble of models, how to best separate poorer performing GCMs from better-performing GCMs, is an ongoing research question, and consensus has not yet been achieved on the subject. The present practices are (1) to use as many GCMs and runs as possible to reduce the influence of model uncertainty and natural variability on results or (2) to choose a single run per GCM. The advantage of this last option is that all GCMs have equal weighting and so a single run per GCM means that each GCM has its variability represented on an equal basis; the disadvantage is that it is technically not making use of all information available. Tests were done for the CMIP5 variables analyzed in Canada’s Changing Climate Report, by comparing results from the two options, and almost no difference was found. Discussions are still ongoing for the CMIP6 ensemble, which contains many GCMs with a higher climate sensitivity than their CMIP5 versions.
b) Dynamically and Statistically Downscaled Ensembles
Detailed regional climate change impact, vulnerability and/or risk assessments and impact models need climate projections for meteorological variables at a higher spatial resolution than that offered by the CMIP ensembles. Dynamically and statistically downscaled ensembles can be used in those situations. The statistical downscaled ensemble based on BCCAQv2, the CanLEAD ensemble (Cannon et al., 2022) and the CORDEX ensembles are the major datasets providing high-resolution climate change projections for meteorological variables for Canada. They take advantage of the most recent generation of international global climate models, the most up-to-date statistical downscaling methods (in BCCAQv2) and the most recent regional climate models (in CORDEX ensembles), as well as the available high-resolution observed gridded datasets over all of Canada (in BCCAQv2). The ensembles provide multiple climate simulations to take into account the spread of model uncertainty (24 members for BCCAQv2 ensemble, 7 RCMs driven by 9 GCMs for CORDEX –NA ensemble, 11 RCMs driven by 4 GCMs for CORDEX-Arctic, and 50 simulations with the Canadian model for the CanLEAD ensemble), and each ensemble has positive and negative points to consider. The following summarizes some of those points.
BCCAQv2:
- The BCCAQv2 ensemble presented on the CCCS webpage and on Climate.Data.ca consists of 24 downscaled runs from the 29 used in Canada’s Changing Climate Report and covers GCM uncertainty well.
- The BCCAQv2 ensemble provides bias-corrected projections on a high-resolution grid of 300 arc seconds (1/12° grids, approx. 10 km), for daily minimum temperature, daily maximum temperature and daily total precipitation. Many climate indices were computed based on these two variables and made available for download on several climate portals in formats suitable for a wide variety of applications: the ensemble percentiles for each month and season of the year can be used in simple risk assessments and communication materials, while daily data for each member of the ensemble is needed for more complex risk assessments based on exceedance thresholds.
- Because the BCCAQv2 methodology downscales maximum and minimum temperature and precipitation independently, these downscaled data cannot be used to compute compound indices that require temporal consistence between temperature and precipitation, or other variables.
- Care must be taken when examining multi-day events (such as indices describing consecutive warm/cold/wet/dry events), as the BCCAQv2 methodology can break up multi-day (i.e., persistent) meteorological events.
- Although there are no analyses of BCCAQv2 results specifically for Northern Canada, some theoretical observations must be considered. BCCAQv2 is correcting GCM biases with respect to ANUSPLIN gridded observations. In locations where the underlying observational data in the target dataset are sparse, such as in the Canadian North, the robustness of the gridded observational dataset is questionable. The quality of the BCCAQv2 output is dependent on the quality of the target dataset, so where few observations exist on which to base BCCAQv2 downscaling, the resulting downscaled products may contain higher uncertainty. The BCCAQv2 results in the Arctic, therefore, are not grounded on a strong observational basis.
- The BCCAQv2 ensemble does not provide projections for other meteorological variables, such as wind and humidity, because it is difficult to construct an accurate gridded historical observational dataset to use as a target for wind and humidity from the limited station observations available in Canada.
CORDEX:
- CORDEX raw-data ensembles provide data for all meteorological variables analyzed in this report, but at a coarser spatial resolution than the BCCAQv2 ensemble. The data is available for download just as raw output from models (no ensemble percentiles are available for download) and can be used as input into regional impact models and for computing simple and complex indices (e.g., fire weather index), which need to respect the temporal consistency between variables. Temperature and precipitation projections (and related climate indices) from CORDEX were analyzed in the context of the Canadian climate (see for example Diaconescu et al., 2018 for the CORDEX ensemble over the Canadian Arctic and Barrette et al. (2020) for the CORDEX ensemble over Nunavik and Nunatsiavut). Diaconescu et al. (2018) showed that most RCMs in the CORDEX-Arctic ensemble were able to simulate climate indices related to mean air temperature and hot extremes well over most of the Canadian Arctic, with the exception of the Yukon region where models displayed biases related to topographic effects. Overall performance was generally poor for indices related to cold extremes, and the Canadian RCMs (CanRCM4 and CRCM5) perform better than reanalyses for precipitation indices. However, there are no studies that have analyzed climate indices based on wind and humidity over the Canadian North. Therefore, the CORDEX performance for those indices is unknown.
- The number of simulations in the CORDEX ensembles is smaller than in CMIP5 or the BCCAQv2 ensembles. According to Andrews et al. (2012) and Flato et al. (2013), the ECS of CMIP5 GCMs spans a range from 2.1 °C to 4.7 °C. The RCM simulations considered in the CORDEX ensembles were driven by GCMs with ECS values spanning a similar interval of values (2.4°C to 4.6°C; see https://na-cordex.org/simulation-matrix). Consequently, the choice of GCMs used for the CORDEX simulations adequately sampled the CMIP5 interval of ECS values ensuring that the uncertainty related to the global scale is adequately represented. Figure 4.8 shows that at the regional level, over Canada, the CORDEX-NA ensemble covers the CMIP5 range well for annual mean temperature and annual mean precipitation.
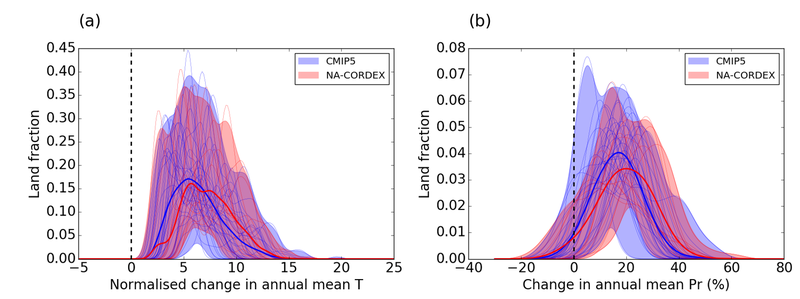
Figure 4.8. Probability Density Function (PDF) showing the land fraction (over Canada) experiencing a given change for the 1976-2100 period (x-axis) with respect to the 1980-2004 period for: (a) annual mean temperature; and (b) annual mean precipitation. Changes in annual mean temperature at each grid point and for each simulation are normalized with respect to the standard deviation of the corresponding simulation over the 1980–2004 period and, for annual mean Pr, as a percentage with respect to the climatological mean of the corresponding simulation over the 1980–2004 period. The light blue/red lines correspond to individual CMIP5/NA-CORDEX simulations, while the blue/red shading shows the range across all CMIP5/NA-CORDEX simulations. The thick blue/red line corresponds to the median PDF of the CMIP5/NA-CORDEX ensemble and was computed by poling together all CMIP5/NA-CORDEX changes. PDFs were computed following the methodology proposed by Fischer et al. (2013).
- CORDEX has also developed a bias-corrected ensemble for daily minimum and maximum temperature, precipitation, specific humidity, and incoming solar radiation, using as target a very high-resolution dataset (Daymet at 1 km x 1 km). Users must keep in mind that the enhanced detail provided does not necessarily mean added value, especially in the Canadian North, because the target high-resolution dataset is based on the same sparse network of stations as the ANUSPLIN dataset used by the BCCAQv2 ensemble. There are no studies that have analyzed the CORDEX bias-corrected ensembles over the Canadian North.
CanLEAD:
- The CanLEAD bias-corrected ensemble has statistically downscaled several meteorological variables from the Canadian Earth System Model Large Ensemble (CanESM2 LE) over North America using a multivariate bias adjusted (MBCn method; Cannon, 2016) against two target datasets with 0.5° x 0.5 spatial resolution. The bias correction method preserves the inter-variable consistency and can be employed to develop complex indices like the meteorological fire weather index. The dataset was used in the Climate Resilient Buildings and Core Public infrastructure report (Cannon et al., 2020), which provides future-looking climate data, including temperature, precipitation and wind data, based on over 660 locations across Canada to be used in building and infrastructure codes and standards. However, there are no studies using these projections that focus only on the Canadian North.
- Data is available only for the high-emission scenario RCP 8.5, and can be used in the ‘’Levels of Global Warming’’ framework to derive projections for the other emission scenarios for Canada only.
- As for the other statistically downscaled ensembles, results for the Canadian North are not grounded on a strong observational basis.
- Because the ensemble is constructed using only one model, the spread covers in large part, but not completely, the CMIP5 spread (see Figure 4.4).
Although the statistically and dynamically downscaled projections have a higher resolution then CMIP5/CMIP6 models, care must be taken in interpreting the data in areas of complex topography (Diaconescu et al. 2018). In such areas, e.g., in Yukon, this resolution may still be too coarse to adequately represent detailed climate gradients. This is particularly apparent when absolute values for threshold-based indices are compared with equivalent values at stations with elevations which are significantly different from the grid-box elevation. Using anomalies, rather than absolute values, is the preferred approach in this case.
A very limited number of analyses were done for climate projections of wind over Canada (e.g., Jeong et al., 2020; Cheng et al., 2012; Jeong and Sushama, 2019) and even fewer related to humidity (e.g., Jeong and Cannon, 2020).
References - meteorological variables:
Andrews, T., J.M. Gregory, M.J. Webb, and K.E. Taylor, 2012: Forcing, feedback and climate sensitivity in CMIP5 coupled atmosphere-ocean climate models. Geophysical Research Letters, 39(9), L09712, doi:10.1029/2012GL051607.
Barrette, C., R.D. Brown, R. Way, A. Mailhot, E.P. Diaconescu, P. Grenier, D. Chaumont, D. Dumont, C. Sévigny, S. Howell, and S. Senneville, 2020: Nunavik and Nunatsiavut regional climate information update. In Ropars, P., M. Allard, and M. Lemay (Editors). Nunavik and Nunatsiavut: From science to policy, an integrated regional impact study (IRIS) of climate change and modernization, second iteration. ArcticNet. Quebec, Quebec, Canada. 58 pp.
Bush, E. and D.S. Lemmen (editors), 2019: Canada’s Changing Climate Report. Government of Canada. Ottawa, ON. 444 pp.
Cannon, A.J., 2016: Multivariate bias correction of climate model output: Matching marginal distributions and intervariable dependence structure. Journal of Climate, 29(19), 7045-7064, doi:10.1175/JCLI-D-15-0679.1.
Cannon, A.J., D.I. Jeong, X. Zhang, and F.W. Zwiers, 2020: Climate-Resilient Buildings and Core Public Infrastructure: An Assessment of the Impact of Climate Change on Climatic Design Data in Canada. Government of Canada, Ottawa, ON. 106 pp.
Cannon, A.J., H. Alford, R.R. Shrestha, M.C. Kirchmeier-Young, and M.R. Najafi, 2021: Canadian Large Ensembles Adjusted Dataset version 1 (CanLEADv1): Multivariate bias-corrected climate model outputs for terrestrial modelling and attribution studies in North America. Geoscience Data Journal, 00, 1– 16, doi:10.1002/gdj3.142.
Cheng, C.S., G. Li, Q. Li, H. Auld, and C. Fu, 2012: Possible Impacts of Climate Change on Wind Gusts under Downscaled Future Climate Conditions over Ontario, Canada. Journal of Climate, 25(9), 3390-3408.
Diaconescu, E.P., A. Mailhot, R. Brown, and D. Chaumont, 2018: Evaluation of CORDEX-Arctic daily precipitation and temperature based climate indices over Canadian Arctic land areas. Climate Dynamics, 50(5-6), 2061-2085, doi:10.1007/s00382-017-3736-4.
Flato, G., J. Marotzke, B. Abiodun, P. Braconnot, S.C. Chou, W. Collins, P. Cox, F. Driouech, S. Emori, V. Eyring, C. Forest, P. Gleckler, E. Guilyardi, C. Jakob, V. Kattsov, C. Reason, and M. Rummukainen, 2013: Evaluation of Climate Models. In: Climate Change 2013: The Physical Science Basis. Contribution of Working Group I to the Fifth Assessment Report of the Intergovernmental Panel on Climate Change [Stocker, T.F., D. Qin, G.-K. Plattner, M. Tignor, S.K. Allen, J. Boschung, A. Nauels, Y. Xia, V. Bex and P.M. Midgley (eds.)]. Cambridge University Press, Cambridge, United Kingdom and New York, NY, USA.
Fischer, E.M., U. Beyerle, and R. Knutti, 2013: Robust spatially aggregated projections of climate extremes. Nature Climate Change, 3(12), 1033-1038, doi: 10.1038/NCLIMATE2051.
Jeong, D.I. and A.J. Cannon, 2020: Projected changes to moisture loads for design and management of building exteriors over Canada. Building and Environment, 170, 106609, doi:10.1016/j.buildenv.2019.106609.
Jeong, D.I., A.J. Cannon, and R.J. Morris, 2020: Projected changes to wind loads coinciding with rainfall for building design in Canada based on an ensemble of Canadian regional climate model simulations. Climatic Change, 162(2), 821–835, doi:10.1007/s10584-020-02745-y.
Jeong, D.I. and L. Sushama, 2019: Projected changes to mean and extreme surface wind speeds for North America based on regional climate model simulations. Atmosphere, 10(9), 497, doi:10.3390/atmos10090497.