It is common practice to present future projections in time series format, such as is shown in Figure 4.4, or for fixed future time periods, e.g., the 2020s, 2050s and 2080s, under different forcing scenarios for different regions. When presented in the latter way, projections from GCMs with different equilibrium climate sensitivities are combined, which makes it difficult to separate uncertainty due to natural internal variability and that due to model uncertainty. A way of presenting future projections which decouples information about regional projections from information about forcing scenarios and model sensitivity is to use fixed levels of global warming.
Seneviratne et al. (2016) showed that proportional changes in extreme temperature and precipitation over large regions are similar across scenarios and models when considered as a function of global mean temperature change. Since this work, other studies (e.g., Li et al., 2018; Schwingshakl et al., 2021) have shown that the relationship between different climate variables and indices and global temperature change generally remains constant. The connection between global mean temperature change and Canadian mean temperature change is shown in Figure 4.5 (left) and provides a way of estimating the implications of global change for Canada under alternative forcing scenarios. Impacts estimated under one forcing scenario can be scaled to approximate impacts under another forcing scenario, since the ratio of regional warming over Canada to global temperature change is roughly constant, in this case about double the global mean rate. Linking regional impacts to specified global warming levels avoids mixing regional projections from models with different climate sensitivities in fixed time periods. The other advantage of this method is that it provides a direct connection with global warming targets, such as the 2015 Paris Agreement to limit global warming to well below 2°C, preferably to 1.5°C.
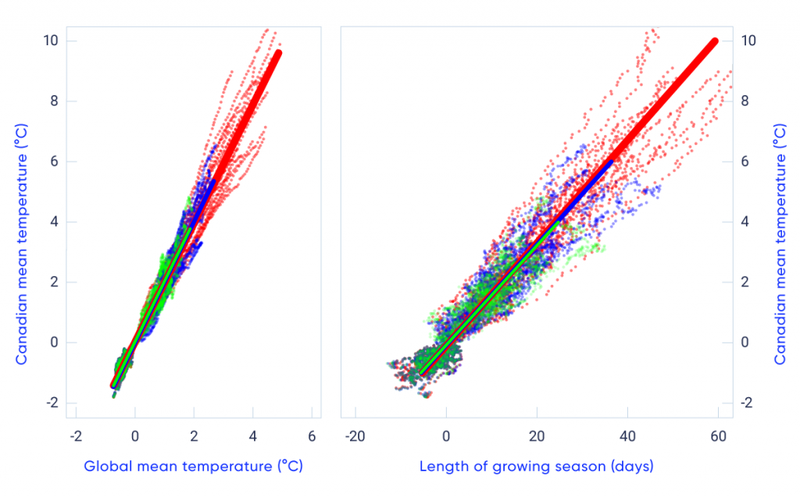
Figure 4.5: Left: Canadian mean temperature change plotted against global mean temperature change (°C for 20-year averages relative to 1986-2005) from CMIP5 GCMs for RCP2.6 (green), RCP4.5 (blue), and RCP8.5 (red). Bold lines are least squares fits, whereas thinner dashed lines are individual model results. Right: Changing length of the growing season (days) for warm season crops in the Canadian prairies as a function of changes in Canadian mean temperature. [Source: Bush and Lemmen, 2019, but adapted from Li et al., 2018]
This level of global warming approach has become more important with the release of the CMIP6 climate model simulations. A number of the CMIP6 climate models have a notably higher equilibrium climate sensitivity than the models in CMIP5. Of the 40 CMIP6 models which have the runs needed to calculate their equilibrium climate sensitivity4, about a third of those models have a climate sensitivity higher than the upper end of the likely range of 1.5°C to 4.5°C. One quarter has a higher sensitivity than any of the models featured in CMIP5, including Canada’s CanESM5, the UK Met. Office’s HadGEM3 model and the Community Earth System Model 2 (CESM2). Research is currently underway to determine what is driving these high climate sensitivity values and initial results indicate that it may be due to their improved representation of clouds and aerosols. By presenting information by levels of global warming, however, allows the visualization of those models with higher climate sensitivity (Figure 4.6).
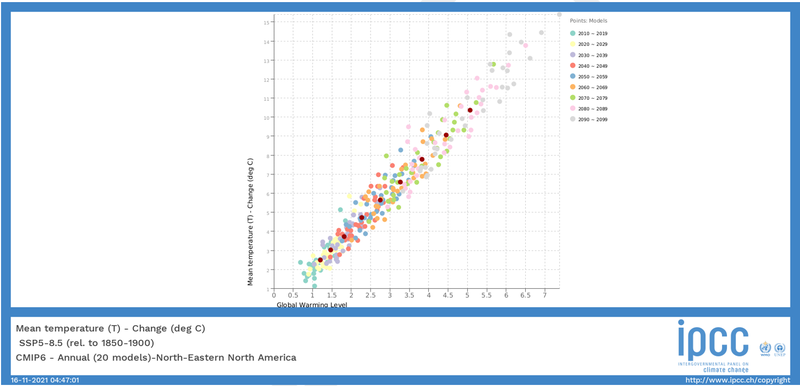
Figure 4.6: Annual mean temperature change (°C) for North-Eastern North America (vertical axis) plotted against global warming levels for SSP5-8.5 (relative to 1850-1900; horizontal axis). Each point represents a different climate model (which can be identified on the interactive page), and each colour indicates the time period when the level of global warming is reached. In this example, the largest increase in global warming is indicated by CanESM5 (top right-hand corner), and this region is warming at approximately twice the rate of the global mean temperature increase. [Source: IPCC Interactive Atlas]