As is apparent from Figures 4.2-4.3, there is uncertainty in the projections of future climate, which often leads to the question ‘Which model should I use?’ This uncertainty stems from the different model responses to the same forcing (model uncertainty), from the different emissions pathways (scenario uncertainty) and from natural variability (natural internal variability uncertainty). The relative influence of each of these sources of uncertainty depends on the climate variable, the spatial scale and the time horizon of interest (Hawkins and Sutton, 2009).
Figure 4.4 illustrates the role of these different sources of uncertainty in temperature simulations from 1950 to 2100, and shows the results at two different spatial scales for three different forcing scenarios (emissions uncertainty – RCPs 2.6, 4.5 and 8.5) from an ensemble of 29 CMIP5 GCMs. The results are also shown from a large ensemble (LE) experiment (50 simulations) using CanESM2, where a single forcing scenario (RCP8.5) was used to explore this model’s range of natural internal climate variability. The bold lines in this figure indicate the ensemble-mean values for each RCP, while the finer lines show the individual model responses.
It is immediately apparent that there is a lot less variability at the global scale (Figure 4.4a) and that the end-of-century change in mean temperature is dominated by the future emissions uncertainty. For Canada (Figure 4.4), however, while the future emissions uncertainty also dominates at the end of the century, model uncertainty plays a larger role at this scale, as indicated by the larger range in results from individual model simulations (fine coloured lines) for each emissions pathway. The results from the CanESM2 LE simulations (purple lines) also show that the natural internal variability plays a larger role at this finer spatial scale. For other climate variables, e.g., precipitation, the role of natural variability may dominate in the near future, particularly at finer spatial scales (e.g., Hawkins and Sutton, 2010; Barrow and Sauchyn, 2019).
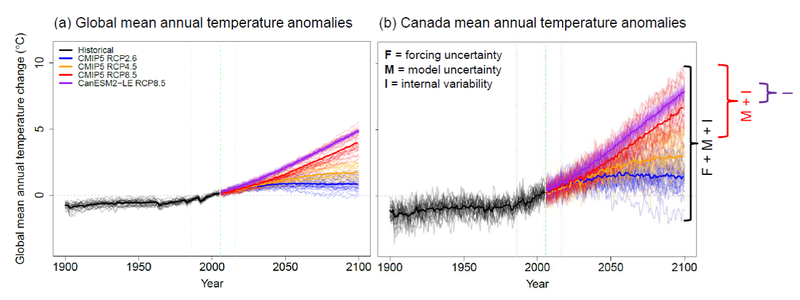
Figure 4.4: Time series of (a) global mean annual temperature anomalies with respect to 1986-2016), and (b) mean annual temperature anomalies for Canada and adjacent waters for 29 CMIP5 GCMs and RCPs 2.6, 4.5 and 8.5 forcing scenarios. The large ensemble experiments with a single GCM, CanESM2 LE are also shown. [Source: Cannon et al., 2020]
While it may seem that some emissions pathways are more likely than others, it is important to consider the range of projected climate from multiple emissions scenarios, rather than relying on a single one. Similarly, it is important to consider the results from multiple climate model simulations to address model uncertainty. By considering a range of possible futures, adaptation options will be more successful at reducing vulnerability and increasing resilience to climate change. While the RCPs are not associated with specific socioeconomic conditions, the more recent SSPs present detailed information about how society may develop, and thus present options for how specific global warming targets (e.g., the Paris Agreement) may be attained.