The RCPs were developed specifically for the climate modelling community by the energy systems modelling community, as a shortcut in the detailed process of developing emissions scenarios, and consist of a set of scenarios of future radiative forcing[2] rather than the detailed socioeconomic storylines usually used to generate emissions scenarios. Thus, the RCPs were not associated with any particular unique socioeconomic pathway or related emissions scenarios (i.e., the radiative forcing scenario could be achieved by following different socioeconomic pathways or emissions scenarios).
There are four original RCPs spanning the plausible range of future climate, with each one describing a GHG emission trajectory, atmospheric GHG concentrations, and consequent radiative forcing by the year 2100. Figure 4.1 illustrates the global mean temperature change associated with RCP2.6 and RCP8.5, and end-of-century temperature change for all four RCPs. They are named after the amount of “radiative forcing” they cause by the end of the century. Under the high emissions pathway, RCP8.5, radiative forcing at 2100 is 8.5 Wm-2 greater than pre-industrial conditions. There are two intermediate ‘stabilization pathways’ in which radiative forcing is stabilized at 6 Wm-2 and 4.5 Wm-2 after 2100, and a single low-emission pathway where radiative forcing peaks at about 3 Wm-2 mid-century before dropping to 2.6 Wm-2 at the end of the century. All RCPs were considered to be equally plausible.
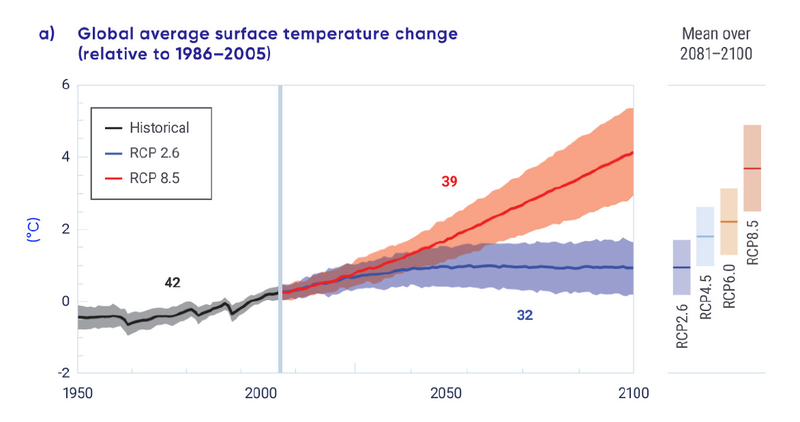
Figure 4.1: CMIP5 multi-model simulations of global average surface temperature change (°C) for 1950 to 2100, relative to 1986-2005 for RCP2.6 and RCP8.5. Bold lines indicate the multi-model mean and the numbers of CMIP5 models used to calculate this mean value are indicated. Coloured bars on the right-hand side indicate the range of end-of-century temperature change for all RCPs [Source: Bush and Lemmen, 2019, but adapted from SPM.7 IPCC, 2013b].
The Shared Socio-Economic Pathways (SSPs; van Vuuren et al., 2014; O’Neill et al., 2017), which have been used in CMIP6, are fully integrated scenario pathways with detailed socioeconomic storylines, including some that align with the original RCPs. They integrate different sets of assumptions about how, for example, population, economic growth, education, urbanization and the rate of technological development may change over the next century. The SSPs are based on five narratives (O’Neill et al., 2017; Riahi et al., 2017) describing broad socioeconomic trends that could shape future society:
SSP1: Taking the Green Road – a world of sustainability-focused growth and equality (SSP1-1.9, SSP1-2.6)
SSP2: Middle of the Road – trends broadly follow their historical patterns (SSP2-4.5)
SSP3: Regional Rivalry – A Rocky Road – a fragmented world of ‘resurgent nationalism’ (SSP3-7.0)
SSP4: Inequality – A Road Divided – a world of ever-increasing inequality (SSP4-3.4, SSP4-6.0)
SSP5: Fossil-fueled Development – Taking the Highway – a world of rapid and unconstrained growth in economic output and energy use (SSP5-8.5).
In addition to four emissions scenarios comparable with the original RCPs, three further emissions scenarios have been developed for the SSPs. SSP1-1.9 is focused on limiting warming to below 1.5°C, the aspirational goal of the Paris Agreement. SSP4-3.4 represents an intermediate pathway between the stringent RCP2.6 and the less stringent mitigation efforts associated with RCP4.5. SSP3-7.0 represents the medium to high end of the range of future emissions and warming. Figure 4.2 illustrates the global mean temperature change associated with the main SSP emissions scenarios.
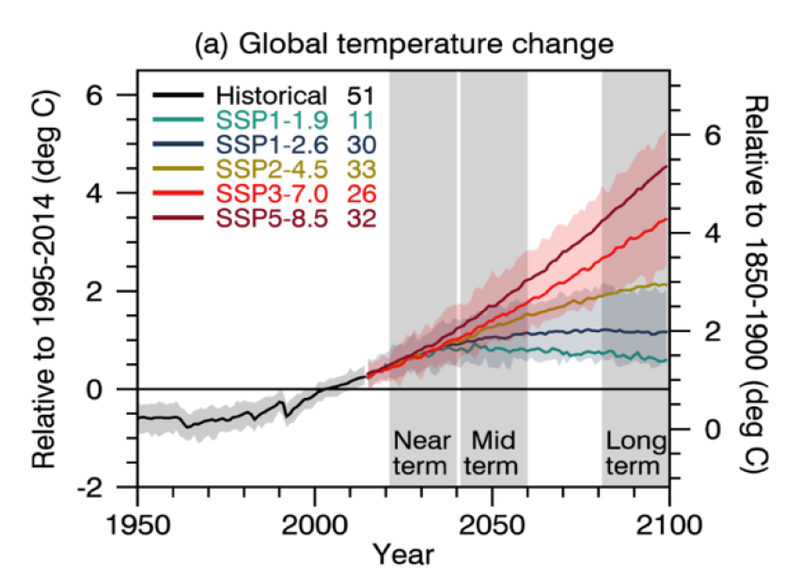
Figure 4.2: Global average temperature change associated with the SSPs. Numbers indicate the number of GCMs/ESMs undertaking experiments for each SSP [Source: Lee et al., 2021].
While the original RCPs and the corresponding SSPs (so RCP2.6 and SSP1-2.6, RCP4.5 and SSP2-4.5, RCP8.5 and SSP5-8.5) have the same approximate level of radiative forcing at the end of the century, they exhibit different levels of warming because the distribution of emissions over time and the proportion of different GHGs and aerosols differ. In addition, the climate models themselves have been updated between CMIP5 and CMIP6, with the latest versions including more climate processes explicitly and operating at a higher spatial resolution. Figure 4.3 compares the annual mean temperature change over Canada associated with the three SSP-based scenarios used in CMIP6 with the RCPs used in CMIP5 (Sobie et al. 2021). The envelope of results from CMIP6 indicates, on average, larger increases in global mean temperature and a larger intermodel spread, particularly for SSP5-8.5 and RCP8.5. Similar results are obtained for global mean temperature in Tebaldi et al. (2021). The larger warming apparent in the CMIP6 simulations is a combination of the slightly different forcing and the presence of models which have higher climate sensitivities[1] in the CMIP6 ensemble than those in the CMIP5 ensemble. The higher climate sensitivities in CMIP6 become more critical for the higher forcings, such as SSP5-8.5 (Tebaldi et al., 2021). A number of studies (e.g., Tokarska et al., 2020) have explored constraining the CMIP6 projections based on an evaluation of the CMIP6 ensemble’s simulation of historical conditions. When constraints are applied, the CMIP6 projections are closer to those of CMIP5 (both the raw projections and those with similar constraints applied). In fact, the IPCC Sixth Assessment Report (Lee et al., 2021) uses constrained projections of global surface mean temperature, because of the higher climate sensitivities exhibited by some of the climate models.
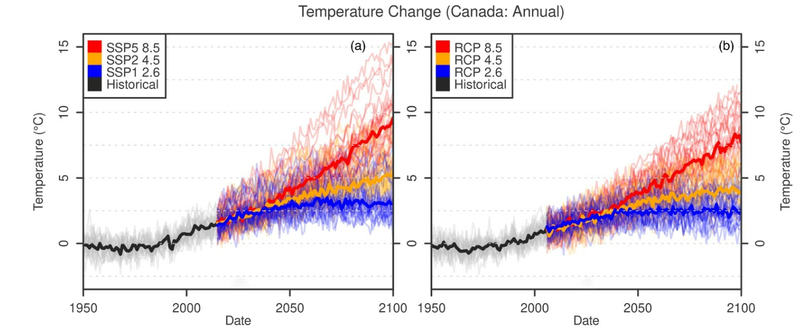
Figure 4.3: Annual average temperature anomalies for Canada from (a) CMIP6 and (b) CMIP5 relative to 1971–2000. Individual GCM simulations are displayed with thin lines and the corresponding ensemble medians are shown as thick lines for each emissions pathway. For CMIP6, the transition from the historical simulation to future SSPs occurs in 2015 compared with 2006 in CMIP5 for the RCPs. The CMIP6 models with the highest temperature response are CanESM5, HadGEM3-GC31-LL, and UKESM1-0-L. [Source: Sobie et al., 2021]
Figures 4.2-4.3 illustrate the global and Canada average temperature change associated with the RCPs and SSPs. However, those values are not typically representative of the temperature change at any individual location. Warming is higher over land than over the oceans, and higher at higher latitudes than it is at low latitudes. Comparing Figures 4.2 and 4.3 shows that Canada as a whole has warmed, and is projected to continue to warm, at about twice the global rate. Northern Canada has warmed at almost triple the global rate (Bush and Lemmen, 2019). A major cause of this Arctic amplification is the melting of sea ice and reduction in snow cover, which reduces the surface albedo and leads to more absorption of incoming solar radiation, further enhancing the warming.
[1] Equilibrium climate sensitivity refers to the amount of global surface warming that will occur in response to a doubling of atmospheric CO2 concentration compared to pre-industrial levels and is estimated to be between 1.5°C and 4.5°C. This wide range is driven by uncertainties in climate feedbacks, including how water vapour, clouds, surface albedo and other factors will change as the Earth warms. Some GCMs exhibit more warming (high climate sensitivity) and others less (low climate sensitivity) in response to the same forcing.