Thermodynamic contributions include sea ice growth and melt in pursuit of a mean state, in contrast to dynamical contributions which include mechanical deformation in the sea-ice cover that gives rise to extremes associated with open water (divergence) and ridging (convergence). Freeboard and draft characterize sea ice thickness, where freeboard is defined as the height of the surface elevation, while draft is the depth of sea ice below the sea surface (Figure 3.6). The satellite record of sea ice thickness provides an indicator of the health of Arctic sea ice as a result of climate change (Tilling et al., 2015; Kwok and Cunningham, 2015; Petty et al., 2020). However, sea ice thickness also influences sea ice compressive strength, heat and gas exchange (Kurtz et al., 2011, Renner et al., 2017) sea ice motion (thinner ice moves faster and is deformed more readily than thicker ice, e.g., Hakkinen et al., 2008; Spreen et al., 2011), freshwater circulation and upper ocean stratification (due to melt through changes to ice volume, a signature of freshwater storage, e.g., Jensen et al., 2016, Carmack et al, 2016), ice volume budgets (Kwok, 2018), productivity rates, navigation and maritime routing (e.g., Haas and Howell, 2015; Mudryk et al., 2021), sea ice forecasts (Balan-Sarojini et al., 2021), and community travel (i.e. SmartICE, Sea Ice Monitoring and Information Inc; https://oceansadvance.net/member/smartice-sea-ice-monitoring-information-inc/ ).
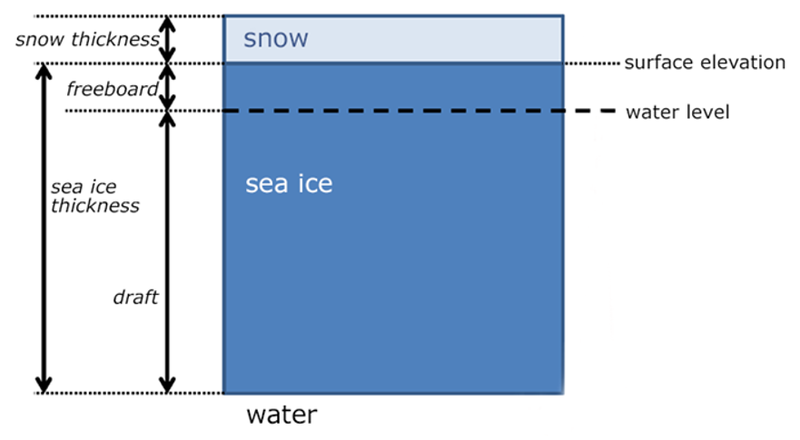
Figure 3.6. Schematic demonstrating elements that define sea ice thickness, including freeboard (ice height above sea level and below snow-ice interface) and draft (ice depth below sea level), in addition to snow thickness, which influences sea ice thickness retrievals. Image courtesy of National Snow and Ice Data Centre (NSIDC), https://nsidc.org/sites/nsidc.org/files/cryosphere/glossary/glossary_freeboard.png
Sea ice thickness data exist in the form of gridded products based on satellite retrievals, including NASA’s Ice, Cloud and land Elevation Satellite (ICESat-1 and -2) and CryoSat-2, as well as in situ observations, including upward looking sonars on submarines and fixed moorings and ground- and aircraft-based electromagnetic induction measurements like Operation IceBridge, which has flights and tracks over the CAA, and in particular along the Northwest Passage in 2010 (Haas, 2004; Haas et al., 2009). It should be noted that satellite laser altimetry (like ICESat-1 and -2) measures the snow+ice freeboard (height of ice and snow cover above sea level), whereas satellite radar altimetry (like CryoSat-2) measures the sea ice freeboard (sea ice height above sea surface). To derive the sea ice thickness through the assumption of hydrostatic equilibrium both techniques require auxiliary estimates of the snow depth, snow density, and ice density (Stroeve and Notz, 2018). The following provides a brief overview of sea ice thickness data of potential interest to data users in northern Canada, in addition to references comparing recent datasets and limitations. As for other sea ice variables, these datasets are featured due to their availability, and local and global coverage, although a comparatively short record of satellite-derived thickness exists relative to satellite-derived sea ice concentration and drift vectors.
| name | source | data type | spatial domain | spatial resolution | temporal coverage | time step | data format | |
|---|---|---|---|---|---|---|---|---|
| Canadian Ice Thickness Program | MSC/ECCC | Station data | Canadian Arctic | Point data | 1947 – 2002;2002 – present (limited number of stations), during ice-cover season | Weekly | Excel files | details |
| Unified Sea Ice Thickness Climate Data Record | R.W. Lindsay; A. Schweiger; NSIDC | Gridded hybrid data: observations, satellite | Arctic | 50 km x 50 km | 1947 - 2017 | Monthly | ASCII | details |
| Operation Ice Bridge | NASA | Aircraft surveys | Arctic Antarctic Alaska | 40 m x 200 m | March and April, 2009 – 2020 | Variable | ASCII | details |
| Ice, Cloud and land Elevation Satellite (ICESat) Geoscience Laser Altimeter System | NASA; NSIDC | Satellite data | Global | 25 km x 25 km | Two to three times per year in winter months; 01/2003-02/2010 | One or several times per year | PNG; Binary; GeoTIFF; ASCII | details |
| ICESat-2 | NASA; NSIDC | Satellite data | Global | 25 km x 25 km | Two to three times per year in winter months; 09/2018 - present | One or several times per year | PNG; Binary; GeoTIFF; ASCII | details |
| Arctic sea ice thickness climate data record | Copernicus | Satellite data | Polar | 25 km x 25 km | October to April, 2003 – present | Monthly | NetCDF | details |
| CryoSat-2 | Helmholtz Center for Polar and Marine Research/AWI | Satellite data | Polar | 25 km x 25 km | October to April, 2010 - present | Monthly | NetCDF | details |
| SMOS | ESA | Satellite data | Polar | 12.5 km x 12.5 km | October to April, 2010 - present | Daily | NetCDF | details |
| SMAP | NASA | Satellite data | polar | 36 km x 47 km | 2015 - 2020 | Daily | HDF | details |
a) Canadian Ice Thickness Program
Landfast sea ice thickness together with snow depth on sea ice measurements have been made regularly at many coastal stations throughout Canada since about 1950. The dataset is available on the Canadian Ice Service web site (https://www.canada.ca/en/environment-climate-change/services/ice-forecasts-observations/latest-conditions/archive-overview/thickness-data.html ). Measurements were recorded in situ to the nearest centimeter using ice augers and hot wire thickness gauges. The measurements are taken once per week, starting after freeze-up when the ice is safe to walk on and continuing until breakup or when the ice becomes unsafe. This product is also included in the Unified Sea ice thickness data record, described further in the next section.
The Canadian Cryospheric Information Network (CCIN) provides a useful resource for visualization of changes in sea ice thickness from the Canadian Ice thickness program (in addition to ice age as a proxy for ice thickness, satellite-derived thickness from ICESat, and modelled thickness from PIOMAS) at specific locations in the Canadian Arctic (https://ccin.ca/ccw/seaice/current/thickness).
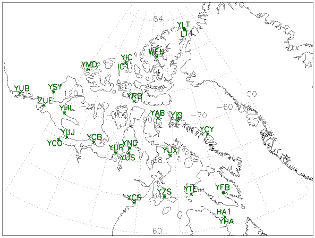
Figure 3.7 Canadian Ice thickness program coastal station locations. Source: Unified Sea Ice Thickness Climate Data Record, University of Washington, http://psc.apl.uw.edu/sea_ice_cdr/figures/canadian_coatal/station_locations.png
Considerations and limitations
This dataset has been used in the evaluation of spatial and temporal variability in landfast ice thickness in the Canadian Arctic (Brown and Cote, 1992; Howell et al., 2016). However, the original Canadian Ice Thickness program ended in 2002 due to a decline in the number of recording sites, and was reinstated in fall, 2012 with a subset of stations. As a result, the sparse spatial distribution and temporal consistency in the dataset limits evaluation of changes in sea ice thickness (and snow depth on sea ice) to particular locations and time intervals. Specifically, there are only a few sites (Cambridge Bay, Resolute, Eureka, and Alert) that provide consistent measurements over the entire record.
a) Unified Sea Ice Thickness Climate Data Record
Sea ice draft, thickness, and sea ice and snow thickness are provided in this dataset from a collection of satellite (freeboard) and in-situ (draft) observations, including upward-looking sonars (ULS) on anchored moorings or submarines, drill hole measurements, airborne and land-based electromagnetic induction (EM) measurements from 1975-2012 (Lindsay and Schweiger, 2015). Evaluation of thickness estimates from 1975-2012 in the central Arctic combined using a curve-fitting approach with this dataset demonstrated a 65% decrease in sea ice thickness in the central Arctic over this timeframe. Comparison amongst observations demonstrated reasonable agreement between ICESat and ULS measurements, with values on the order of 0.11 m.
Considerations and limitations
Limited spatial and temporal sampling hinder long-term evaluation of changes in sea ice thickness at arbitrary locations provided by a gridded product. Uncertainty associated with individual instruments and measurements will also be required in analyses that use this product. Sources of uncertainty include sampling errors, measurement errors, systematic errors, and errors associated with the regression procedure used to combine multiple data products (Lindsay and Schweiger, 2015). An absence of continuous spatial and temporal coverage could be addressed in part by a Lagrangian interpretation of changes in sea ice thickness such as is provided by drifting ice mass balance buoys.
b) Satellite-derived sea ice thickness products (CryoSat-2 and ICESat-1/ICESat-1/2)
CryoSat and ICESat retrievals require pre-processing of altimetry data to derive surface elevation and subsequently sea ice thickness. For altimetry data from CryoSat-2, specular (peaked) and diffuse (broadly distributed) radar echoes distinguish leads/thin ice and ocean waveforms, respectively (Tilling et al., 2018). Diffuse echoes are further characterized as ice floes in regions exceeding 75% sea ice concentration derived from a 25 km grid. Ice types are identified from OSISAF, and separate retracking techniques are applied to specular and diffuse echoes, from which the ocean surface elevation of the leads and surface elevations of the sea ice floes are determined. Radar freeboard is determined from the elevation difference between leads and sea ice floe surfaces. For altimetry data from ICESat-1 and -2, snow+ice freeboard heights are computed from the difference between surface elevation and sea surface elevation associated with leads in 10 km intervals for regions located 25 km from the coastline where sea ice concentrations exceed 50% (Kwok et al., 2020). Assuming hydrostatic balance, sea ice thickness is calculated from the freeboard by accounting for the snow loading on the sea ice (i.e., the depth multiplied by the density), and using sea ice and ocean densities to determine how much of the ice is sitting below sea level. Conventional methods have used a long-term climatology (i.e., averaged) snow depth and density maps compiled from direct measurements at Russian drifting stations in the 1950-1990s to make the conversion from freeboard to thickness (Warren et al., 1999). A limitation of altimetry is that sea ice thickness data rely on regular measurements of the sea surface height at leads, which are sparse in the narrow channels of the Canadian Arctic, so data are often missing or unreliable for these regions. Cryosat-2 data is available from 2010 to present, ICESat-1 from 2003-2008, and ICESat-2 from 2018 to present. Snow+ice freeboard, snow depth, and sea ice thickness were provided by the airborne survey Operation IceBridge during the gap between the ICESat-1 and ICESat-2 missions (Kurtz et al., 2013; Tschudi et al., 2016).
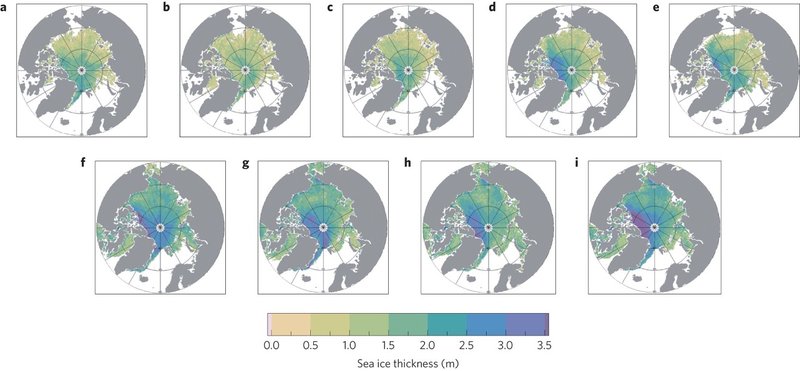
Figure 3.8 Maps of sea ice thickness derived from CryoSat-2 during autumn (October – November; top row) from 2010-2014, and spring (March – April; bottom row) from 2011-2015. [Source: Tilling et al., 2018.]
a) SMOS/SMAP
Soil Moisture and Ocean Salinity (SMOS)–derived sea ice thickness is computed from brightness temperatures recorded by the L-Band radiometer on the mission, and is effective in identifying thin ice (Kaleschke et al., 2012). NASA’s Soil Moisture Active Passive (SMAP) -derived sea ice thickness is also derived from brightness temperatures observed by a scanning radiometer with a fixed incidence angle onboard the satellite (Patilea et al., 2019).
Considerations and Limitations
A notable source of error for radar altimeters (i.e., CryoSat-2) is the location of the radar scattering horizon in the snow-ice system. An error source for both radar and laser altimeters (i.e., CryoSat-2 and ICESat-1/2) is the snow depth on the sea ice (Giles et al., 2007). The temporal limitation with satellite altimetry is that sea ice thickness estimates are not available during the summer melt season and do not cover a long temporal domain. Spatially, the estimates are limited to areas in close proximity to leads and therefore are less reliable for landfast regions (i.e. Canadian Arctic Archipelago). A recent comparison of sea ice thickness satellite and in situ observations demonstrated that CryoSat-2 provided a reliable estimate of thicknesses ranging from 0.5 to 4 m, while a combined CrysoSat-2 and Soil Moisture and Ocean Salinity product provided a reasonable estimate of thin ice (Salilla et al., 2019). Also SMOS/SMAP are limited by sensor resolution (~62 km) in the CAA channels.
b) Arctic Sea Ice Thickness Climate Data Record
Monthly sea ice thickness data for winter months from 2002 based on satellite radar altimetry observations (C3S thickness product, from Envisat and CryoSat-2 satellite imagery) is derived using sea ice freeboard, constant sea water density, snow density and depth from a climatology (with 50% snow depth over first-year sea ice; Warren et al., 1999), and sea ice density categorized based on ice type (first-year ice and multi-year ice; C3S Algorithm Theoretical Basis Document). This is a gridded product that includes a variety of measurements and is comparable to the Unified Sea Ice Thickness Climate Record of in situ thickness observations.
An additional product of interest that simulates sea ice thickness is the Pan-Arctic Ice-Ocean Modeling and Assimilation System (PIOMAS; Zhang and Rothrock, 2003), a coupled ice-ocean model that has the ability to assimilate satellite sea ice concentration and velocity data, and sea surface temperature observations (Schweiger et al., 2011). The sea ice model simulates sea ice ridging following the Thorndike et al. (1975) sea ice thickness distribution theory, and consists of thermodynamic and dynamic components that characterize sea ice growth/decay and sea ice drift, deformation, and redistribution, respectively. PIOMAS sea ice thickness agrees reasonably well with satellite laser altimetry and submarine data observations (Schweiger et al., 2011). Currently, PIOMAS provides the most realistic estimate for sea ice thickness in the absence of satellite observations for sea ice thickness in summer.
References - Sea ice thickness
Balan-Sarojini, B., S. Tietsche, M. Mayer, M. Balmaseda, H. Zuo, P. De Rosnay, T. Stockdale, and F. Vitart, 2021: Year-Round Impact of Winter Sea Ice Thickness Observations on Seasonal Forecasts. The Cryosphere 15, 325-344, doi:10.5194/tc-15-325-2021.
Brown, D., and P. Cote, 1992: Interannual Variability of Landfast Ice Thickness in the Canadian High Arctic, 1950–89. Arctic, 45(3), 273-284.
Carmack, E.C., M. Yamamoto‐Kawai, T.W.N. Haine, S. Bacon, B.A. Bluhm, C. Lique, H. Melling, I.V. Polyakov, F. Straneo, M.-L. Timmermans, and W.J. Williams, 2016: Freshwater and Its Role in the Arctic Marine System: Sources, Disposition, Storage, Export, and Physical and Biogeochemical Consequences in the Arctic and Global Oceans. Journal of Geophysical Research: Biogeosciences, 121(3), 675-717, doi:10.1002/2015jg003140.
Giles, K.A., S.W. Laxon, D.J. Wingham, D.W. Wallis, W.B. Krabill, C.J. Leuschen, D. McAdoo, S.S. Manizade, and R.K. Raney, 2007: Combined Airborne Laser and Radar Altimeter Measurements Over the Fram Strait in May 2002. Remote Sensing of Environment, 111(2–3), 182-194, doi.org/10.1016/j.rse.2007.02.037.
Gregory, W., I.R. Lawrence, and M. Tsamados, 2021: A Bayesian Approach Towards Daily Pan-Arctic Sea Ice Freeboard Estimates from Combined CryoSat-2 and Sentinel-3 Satellite Observations. The Cryosphere, 15(6), 2857-2871, https://doi.org/10.5194/tc-15-2857-2021.
Haas, C., and Howell, S. E. L., 2015: Ice thickness in the Northwest Passage, Geophys. Res. Lett., 42, 7673– 7680, doi:10.1002/2015GL065704.
Haas, C., J. Lobach, S. Hendricks, L. Rabenstein, and A. Pfaffling, 2009: Helicopter-Borne Measurements of Sea Ice Thickness, Using a Small and Lightweight, Digital EM System. Journal of Applied Geophysics, 67(3), 234-241, doi.org/10.1016/j.jappgeo.2008.05.005.
Haas, C., 2004: Late-Summer Sea Ice Thickness Variability in the Arctic Transpolar Drift 1991-2001 Derived from Ground-Based Electromagnetic Sounding. Geophysical Research Letters, 31(9), L09402, doi:10.1029/2003GL019394.
Hakkinen, S., A. Proshutinsky, and I. Ashik, 2008: Sea Ice Drift in the Arctic Since the 1950s. Geophysical Research Letters, 35(19), L19704, doi:10.1029/2008gl034791.
Jensen, M.F., J. Nilsson, and K.H. Nisancioglu, 2016 : The Interaction Between Sea Ice and Salinity-Dominated Ocean Circulation: Implications for Halocline Stability and Rapid Changes of Sea Ice Cover. Climate Dynamics, 47(9–10), 3301-3317, doi:10.1007/s00382-016-3027-5.
Kurtz N.T., T. Markus, S.L. Farrell, D.L. Worthen, and L.N. Boisvert, 2011: Observations of Recent Arctic Sea Ice Volume Loss and Its Impact on Ocean–Atmosphere Energy Exchange and Ice Production. Journal of Geophysical Research, 116(C4), C04015, doi: 10.1029/2010JC006235.
Kurtz, N.T., S.L. Farrell, M. Studinger, N. Galin, J.P. Harbeck, R. Lindsay, V.D. Onana, B. Panzer, and J.G. Sonntag, 2013: Sea Ice Thickness, Freeboard, and Snow Depth Products from Operation IceBridge airborne Data. The Cryosphere, 7(4), 1035-1056, doi:10.5194/tc-7-1035-2013.
Kwok, R., 2018: Arctic Sea Ice Thickness, Volume, and Multiyear Ice Coverage: Losses and Coupled Variability (1958-2018). Environmental Research Letters, 13(10), 105005, doi.org/10.1088/1748-9326/aae3ec.
Kwok R., and G.F. Cunningham, 2015: Variability of Arctic Sea Ice Thickness and Volume from CryoSat-2. Philosophical Transactions of the Royal Society of London Series A: Mathematical, Physical, and Engineering Sciences, 373(2045), 20140157, doi.org/10.1098/rsta.2014.0157.
Labe, Z., The Climate Data Guide: Sea Ice Thickness Data Sets: Overview and Comparison Table. National Center for Atmospheric Research, Retrieved from: https://climatedataguide.ucar.edu/climate-data/sea-ice-thickness-data-sets-overview-comparison-table.
Lenormand, F., C.R. Duguay, and R. Gauthier, 2002: Development of a Historical Ice Database for the Study of Climate Change in Canada. Hydrological Processes, 16(18), 3707-3722, doi.org/10.1002/hyp.1235.
Lindsay, R., and A.J. Schweiger, 2013 (updated 2017): Unified Sea Ice Thickness Climate Data Record, 1947 Onward, Version 1. Boulder, Colorado USA. NSIDC: National Snow and Ice Data Center, doi.org/10.7265/N5D50JXV.
Lindsay, R., and A. Schweiger, 2015: Arctic Sea Ice Thickness Loss Determined Using Subsurface, Aircraft, and Satellite Observations. The Cryosphere, 9(1), 269-283, doi:10.5194/tc-9-269-2015.
Mallett, R.D.C., J.C. Stroeve, M. Tsamados, J.C. Landy, R. Willatt, V. Nandan, and G.E. Liston, 2021: Faster Decline and Higher Variability in the Sea Ice Thickness of the Marginal Arctic Seas when Accounting for Dynamic Snow Cover. The Cryosphere, 15(5), 2429-2450, doi:10.5194/tc-15-2429-2021.
Mudryk, L.R., Dawson, J., Howell, S.E.L. et al., 2021: Impact of 1, 2 and 4 °C of global warming on ship navigation in the Canadian Arctic. Nat. Clim. Chang. 11, 673–679. https://doi.org/10.1038/s41558-021-01087-6.
Paţilea, C., G. Heygster, M. Huntemann, and G. Spreen, 2019: Combined SMAP–SMOS Thin Sea Ice Thickness Retrieval. The Cryosphere, 13(2), 675-691, doi.org/10.5194/tc-13-675-2019.
Petty, A. A., N. T. Kurtz, R. Kwok, T. Markus, T. A. Neumann, 2020: Winter Arctic sea ice thickness from ICESat‐2 freeboards, Journal of Geophysical Research: Oceans, 125, e2019JC015764. doi:10.1029/2019JC015764.
Renner, A.H.H., S. Hendricks, S. Gerland, J. Beckers, C. Haas, and T. Krumpen, 2013: Large-Scale Ice Thickness Distribution of First-Year Sea Ice in Spring and Summer North of Svalbard. Annals of Glaciology, 54(62), 13-18, doi:10.3189/2013aog62a146.
Richter-Menge, J.A., D.K. Perovich, B.C. Elder, K. Claffey, I. Rigor, and M. Ortmeyer, 2006: Ice Mass-Balance Buoys: A Tool for Measuring and Attributing Changes in the Thickness of the Arctic Sea-Ice Cover. Annals of Glaciology, 44(1), 205-210, doi:10.3189/172756406781811727.
Sallila, H., S.L. Farrell, J. Mccurry, and E. Rinne, 2019: Assessment of Contemporary Satellite Sea Ice Thickness Products for Arctic Sea Ice. The Cryosphere, 13(4), 1187-1213, doi:10.5194/tc-13-1187-2019.
Schweiger, A., R. Lindsay, J. Zhang, M. Steele, H. Stern, and R. Kwok, 2011: Uncertainty in modeled Arctic sea ice volume: J. Geophysical Research, 116, C8, https://doi.org/10.1029/2011JC007084.
Spreen, G., R. Kwok, and D. Menemenlis, 2011: Trends in Arctic Sea Ice Drift and Role of Wind Forcing: 1992-2009. Geophysical Research Letters, 38(19), doi:10.1029/2011gl048970.
Stroeve, J., A. Barrett, M. Serreze, and A. Schweiger, 2014: Using Records from Submarine, Aircraft and Satellites to Evaluate Climate Model Simulations of Arctic Sea Ice Thickness. The Cryosphere, 8(5), 1839-1854, doi:10.5194/tc-8-1839-2014.
Stroeve, J., and D. Notz, 2018: Changing State of Arctic Sea Ice Across All Seasons. Environmental Research Letters, 13(10), 103001. doi:10.1088/1748-9326/aade56.
Thorndike, A.S., D.A. Rothrock, G.A. Maykut, and R. Colony, 1975: The Thickness Distribution of Sea Ice. Journal of Geophysical Research, 80, 4501-4513, doi:10.1029/jc080i033p04501.
Tschudi, M., J. Stroeve, and J. Stewart, 2016: Relating the Age of Arctic Sea Ice to Its Thickness, as Measured During NASA’s ICESat and IceBridge Campaigns. Remote Sensing (Basel, Switzerland), 8(6), 457, doi.org/10.3390/rs8060457.
Tilling, R.L., A. Ridout, A. Shepherd, and D.J. Wingham, 2015: Increased Arctic Sea Ice Volume After Anomalously Low Melting in 2013. Nature Geoscience, 8(8), 643-646, doi.org/10.1038/ngeo2489.
Warren, S.G., I.G. Rigor, N. Untersteiner, V.F. Radionov, N.N. Bryazgin, and Y.I. Aleksandrov, 1999: Snow Depth on Arctic Sea Ice. Journal of Climate, 12(6), 1814-1829, doi.org/10.1175/1520-0442(1999)012<1814:SDOASI>2.0.CO;2.
Yi, D., and H.J. Zwally, 2009 (updated 2014): Arctic Sea Ice Freeboard and Thickness, Version 1. Boulder, Colorado USA. NASA National Snow and Ice Data Center Distributed Active Archive Center, doi.org/10.5067/SXJVJ3A2XIZT.
Zhang, J. and D.A. Rothrock, 2003: Modeling global sea ice with a thickness and enthalpy distribution model in generalized curvilinear coordinates, Mon. Wea. Rev., 131(5), 681 – 697.