The relevance of climate data to users for a variety of applications is determined by a range of spatial and temporal scales (Figure 3.3) (Wagner et al., 2020). Sea ice concentration datasets are commonly used for monitoring and mapping, especially to estimate sea ice extent and sea ice area, which are the most widely used indictors to assess long-term climate change for sea ice (e.g., Comiso et al., 2017; Derksen et al., 2019). Sea ice concentration data is also a vital input for reanalysis products and forecasting models (Guemas et al., 2014; Chavellier et al., 2016). Finally, a variety of stakeholders (e.g., cruise operators, commercial traders, fishery operators, researchers, and resource extraction companies, to name but a few) also rely on sea ice concentration data for planning purposes (Wagner et al., 2020). Sea ice concentration data in northern Canada is primarily available through the Canadian Ice Service (CIS) digital ice charts and passive microwave satellite observations. The following provides a brief overview of these two primary data sources for potential interest to data users in Northern Canada, in addition to references comparing the datasets and limitations. These datasets are featured in light of their availability, decades-long duration, and regional and global coverage; they are also widely used in deriving global sea ice climate indicators (i.e. sea ice extent and area).
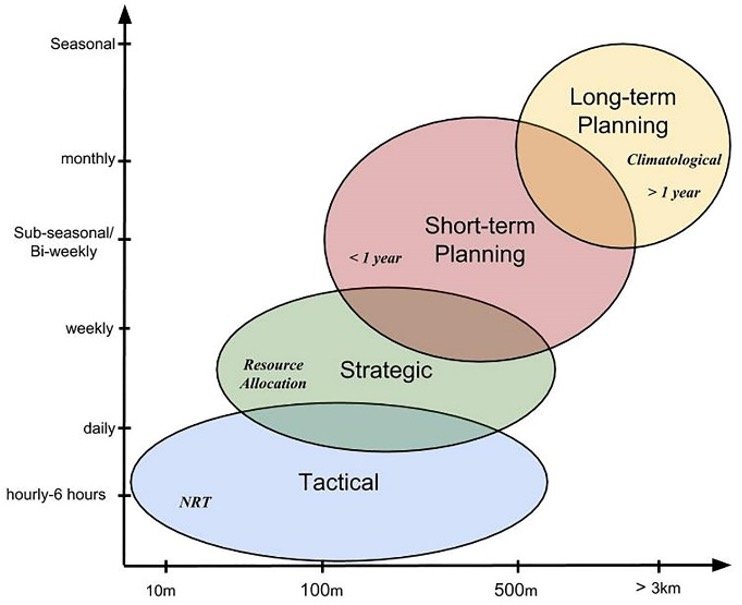
Figure 3.3. The range of spatial and temporal scales relevant for various applications and operations. [Source: Wagner et al., 2020].
| name | source | data type | spatial domain | spatial resolution | temporal coverage | time step | data format | |
|---|---|---|---|---|---|---|---|---|
| CIS Ice Charts, Ice Atlas and the Icegraph tool | MSC/ECCC | Gridded hybrid data: observations, satellite | Canada | 200 m | Canadian Western Arctic (1968 to present), Canadian Eastern Arctic (1968 to present), Hudson Bay (1971 to present) and the East Coast of Canada (1968 to present) | Weekly | Digital charts; Shapefiles; DEX; GIG; CSV; Interactive web-tool images | details |
| Sea Ice Index Version 3 | NSIDC | Satellite data | Global | 25 km x 25 km | 1978 to present | Daily | PNG; Shapefiles; CSV; GeoTIFF | details |
| NOAA/NSIDC Climate Data Record of Passive Microwave Sea Ice Concentration Version 4 and the sea ice tools | NSIDC | Satellite data | Global | 25 km x 25 km | 1978 to present | Daily | NetCDF; CSV; Interactive web-tool images | details |
| OSI-SAF version 2 | EUMETSAT | Satellite data | Global | 25 km x 25 km | 1979 to present | Daily | NetCDF | details |
a) Canadian Ice Service digital ice charts
The CIS Digital Ice Charts is a compilation of all weekly ice charts produced by the CIS which include estimates of sea ice concentration for the Canadian Western Arctic (1968 to present), Canadian Eastern Arctic (1968 to present), Hudson Bay (1971 to present) and the East Coast of Canada (1968 to present). The digital ice charts are derived from 1:4 million scale hard copy charts that have been digitized in a topologically complete polygon database in an Arc/Info Geographic Information System. Each digital chart covers a sea surface area of 1.2-2.2 million km2 (i.e. spatial resolution of ~200 m) and comprises all the information contained in the WMO international sea ice code (Figure 3.4). They are based on an analysis and integration of all available data on ice conditions, including weather and oceanographic information, visual observations from shore, ship and aircraft, airborne radar, satellite imagery and climatological information (Tivy et al., 2011). CIS sea ice charts provide a local and regional interpretation of ice conditions that can be used for long-term analysis but they are relevant for tactical and strategic considerations, including navigation during the open-water season and weekly forecasts. The CIS ice charts have been found to be more accurate than passive microwave ice concentration estimates that can underestimate sea ice concentration by as much as 44% during the shoulder seasons (Agnew and Howell, 2003).
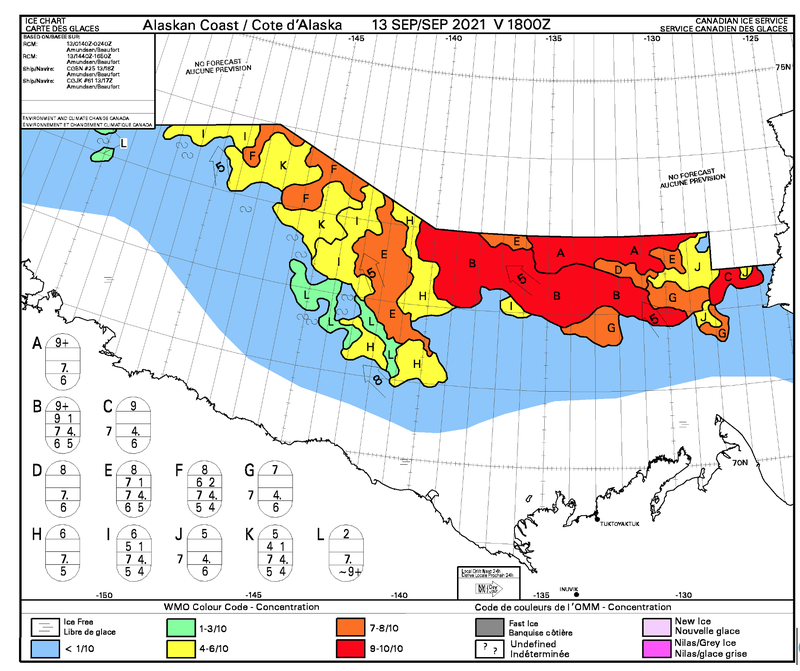
Figure 3.4. Example of a daily CIS sea ice chart for the western Arctic on 13 September, 2021, depicting contiguous sea ice concentration regimes in the Beaufort Sea region.
Considerations and Limitations
A consideration that needs to be taken into account when using the CIS digital ice charts is that their temporal domain has changed with time. Specifically, the Canadian Western Arctic, Canadian Eastern Arctic, and Hudson Bay ice charts were produced on a weekly basis only during summer season up until 1981. In 1982, monthly ice charts during the winter seasons were included for aforementioned regions. Beginning in March 2006, that frequency was increased to twice a month during the winter. Since the fall of 2011, Canadian Western Arctic, Canadian Eastern Arctic, and Hudson Bay ice charts have been issued weekly year-round. Finally, ice charts for the East Coast are produced on a weekly basis during the winter season only.
Another consideration of the ice charts is that the data sources have changes over time as well as changes in regional focus due to the emergence of important shipping routes. Tivy et al. (2011) performed an extensive evaluation of the CIS ice charts and found no evidence of time-varying biases in the period since 1979. However, pre-1979 overestimation of sea ice concentration in the northern regions of the Canadian Eastern and Western Arctic are possible.
A final consideration with respect to the CIS ice charts is that high spatial resolution RADARSAT imagery from RADARSAT-1 (1996-2013), RADARSAT-2 (2007-2020), and the RADARSAT Constellation Mission (2020 to present) has been the primary sensor used in the production of the ice charts since 1996. Therefore, ice charts from 1996 to present are expected to be more representative and of higher quality with respect to their sea ice concentration estimates (e.g., Cheng et al., 2020)
Climate data products and tools for CIS regional ice charts
Climate data products and online tools to explore CIS regional ice charts exist through the Ice Atlas and icegraph tool. In particular, the Ice Atlas provides: (a) regional analyses based on climate normals for the 1981-2010 timeframe, (b) a description of techniques and indicators used characterize ice conditions for the 1981-2010 timeframe, (c) atmospheric and oceanic contributions to regional changes in sea ice, (d) regional descriptions of freeze-up and break-up seasons, and (e) ice charts and supporting information for the eastern, western, and northern Canadian Arctic and Hudson Bay. Icegraph is an interactive tool used to generate ice coverage bar graphs and data tables for specified time intervals and regions of interest.
a) Passive Microwave Satellite Observations
Sea ice concentration has been monitored from space almost continuously since 1978 using passive microwave measurements from the Scanning Multichannel Microwave Radiometer (SMMR) instrument on the Nimbus-7 satellite and the Special Sensor Microwave/Imager (SSM/I) and Special Sensor Microwave Imager/Sounder (SSMIS) satellite platforms. Spatial and temporal uniformity in passive microwave satellite observations over several decades provides a regional and global interpretation of ice conditions relevant for climatological assessments and planning on daily, weekly and seasonal timescales. Passive microwave sea ice concentration datasets are also the most common datasets to calculate long-term trends in sea ice extent and area. Sea ice extent indicates the area of a region covered by ice exceeding a 15%, and sea ice area indicates the area of an ice-covered region multiplied by the fractional sea ice concentration.
Microwave emissions can pass through cloud, but are slightly affected by snow and rain. An empirical relationship between microwave brightness temperatures at different wavelengths is used to distinguish sea ice from open water. The sea ice fraction is calibrated using observations (tie points) of 100% open water and 100% ice-covered. As a result, there are many different algorithms used to estimate sea ice concentration and hence many different sea ice concentration products (e.g., Kern et al., 2019). However, the most widely used sea ice concentration datasets are the Sea Ice Index Version 3 (Fetterer et al., 2017), NOAA/NSIDC Climate Data Record of Passive Microwave Sea Ice Concentration, Version 4 (Meier et al., 2021) and Satellite Application Facility on Ocean and Sea Ice (OSI-SAF) Version 2 (Lavergne et al., 2019). Figure 3.5 depicts the Sea Ice Index and near-real-time sea ice concentration from NSIDC and OSI-SAF products.
Sea Ice Index
This dataset includes monthly sea ice concentration, anomaly (departures from the 1981-2010 median value), trend (from 1981 to the present year), and sea ice extent images; daily sea ice concentration and extent images, in addition to calculated values for hemisphere-wide monthly and daily sea ice extent and area, and daily average sea ice extent from 1981-2010. The dataset is created by estimating sea ice concentration from the NASA Team algorithm (Cavalieri et al. 1997) which converts brightness temperatures to gridded ice concentration estimates. The sea ice index is perhaps the most well-known dataset as it is used for the NSIDC Arctic Sea Ice News (http://nsidc.org/arcticseaicenews/ ). The data is available daily from 26 October 1978 to present.
Climate data products and tools for NSIDC passive microwave dataset
Sea Ice Data Analysis and Tools further provides online tools to explore the NSIDC passive microwave dataset, including interactive sea ice graphs showing daily sea ice extent for specified years, spreadsheets with the data, interactive maps, and animations.
NOAA/NSIDC Climate Data Record of Passive Microwave Sea Ice Concentration
This dataset provides a Climate Data Record of sea ice concentration from passive microwave data. The Climate Data Record algorithm output is a rule-based combination of ice concentration estimates from two well-established algorithms: the NASA Team algorithm (Cavalieri et al. 1984) and NASA Bootstrap algorithm (Comiso, 1986). The Climate Data Record is a consistent, daily and monthly time series of sea ice concentrations from 25 October 1978 through the most recent processing for both the north and south hemispheres.
OSI-SAF
Sea ice concentration estimates for OSI-SAF are retrieved using dynamic tie points that capture the time evolution of surface characteristics of the ice cover. This also allows for potential calibration differences between satellite missions to be accounted for. ERA-Interim data is used for a correction of the atmospheric influence on brightness temperatures. OSI-SAF sea ice concentration estimates are available from January 1979 to present.
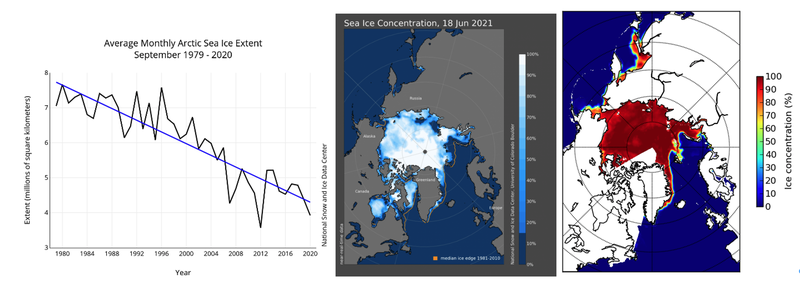
Figure 3.5. Examples of sea ice concentration products including (from left), Monthly September ice extent for 1979 to 2020 shows a decline of 13.1 percent per decade from the Sea Ice Index dataset, map of near-real-time NSIDC sea ice concentration and median 1981-2010 ice extent, and OSI-SAF sea ice concentration for June 18, 2021.
Considerations and Limitations
Data employ different assumptions and corrections to account for differing surface conditions and the effects of snow and rain. Users of sea ice data should be aware of the differences between algorithms, their attributes, and the methods for combining different source data into long-term datasets (i.e. Kern et al., 2019; Meier and Stewart, 2019). Resolving the position of ice edge or marginal ice zone, coastal contamination, thin ice and melt ponds forming on the surface of the sea ice are the primary sources of uncertainty (Ivanova et al., 2015; Kern et al., 2016; Comiso et al., 2017). Further, construction of a 40+ year sea ice extent record requires combing sensors together as their operational lifetime eventually fails and therefore uncertainty can vary temporally depending on the quality of sensor intercalibration (e.g., Eisenman et al., 2014). Although today the passive microwave record has a daily resolution, it had a 2-day resolution prior to July 1987.
References - Sea Ice Concentration
Agnew, T., and S. Howell, 2003: The use of operational ice charts for evaluating passive microwave ice concentration data. Atmosphere-Ocean, 41, 317–331, https://doi.org/10.3137/ao.410405.
Cavalieri, D.J., P. Gloersen, and W.J. Campbell, 1984: Determination of sea ice parameters with the NIMBUS 7 SMMR. J. Geophys. Res., 89, 5355–5369, https://doi.org/10.1029/jd089id04p05355.
Cavalieri, D.J., C.L. Parkinson, P. Gloersen, and H.J. Zwally, 1997: Arctic and Antarctic Sea Ice Concentrations from Multichannel Passive-Microwave Satellite Data Sets: October 1978-September 1995 - User's Guide. NASA TM 104647. Goddard Space Flight Center, Greenbelt, MD 20771, pp17
Chevallier, M., G.C. Smith, F. Dupont, J.-F. Lemieux, G. Forget, Y. Fujii, F. Hernandez, R. Msadek, K.A. Peterson, A. Storto, T. Toyoda, M. Valdivieso, G. Vernieres, H. Zuo, M. Balmaseda, Y.-S. Chang, N. Ferry, G. Garric, K. Haines, S. Keeley, R.M. Kovach, T. Kuragano, S. Masina, Y. Tang, H. Tsujino and X. Wang, 2016: Intercomparison of the Arctic sea ice cover in global ocean–sea ice reanalyses from the ORA-IP project. Clim Dyn, 49, 1107–1136, https://doi.org/10.1007/s00382-016-2985-y.
Cheng, A., B. Casati, A. Tivy, T. Zagon, J.-F. Lemieux, and L.B. Tremblay, 2020: Accuracy and inter-analyst agreement of visually estimated sea ice concentrations in Canadian Ice Service ice charts using single-polarization RADARSAT-2. The Cryosphere, 14, 1289–1310, https://doi.org/10.5194/tc-14-1289-2020.
Comiso, J.C., W.N. Meier, and R. Gersten, 2017: Variability and trends in the Arctic Sea ice cover: Results from different techniques. J. Geophys. Res. Oceans, 122, 6883–6900, https://doi.org/10.1002/2017jc012768.
Comiso, J.C., 1986: Characteristics of Arctic winter sea ice from satellite multispectral microwave observations. J. Geophys. Res., 91, 975, https://doi.org/10.1029/jc091ic01p00975.
Derksen, C., D. Burgess, C. Duguay, S. Howell, L. Mudryk, S. Smith, C. Thackeray and M. Kirchmeier-Young, 2019: Changes in snow, ice, and permafrost across Canada: Chapter 5. In E. Bush & D. S. Lemmen (Eds.), Canada's Changing Climate Report (pp. 194–260). Ottawa, Ontario: Government of Canada.
Eisenman, I., W.N. Meier, and J.R. Norris, 2014: A spurious jump in the satellite record: has Antarctic sea ice expansion been overestimated? The Cryosphere, 8, 1289–1296, https://doi.org/10.5194/tc-8-1289-2014.
Fetterer, F., K. Knowles, W.N. Meier, M. Savoie, and A.K. Windnagel, 2017: updated daily. Sea Ice Index, Version 3. Boulder, Colorado USA. NSIDC: National Snow and Ice Data Center, https://doi.org/10.7265/N5K072F8.
Guemas, V., E. Blanchard-Wrigglesworth, M. Chevallier, J.J. Day, M. Déqué, F.J. Doblas-Reyes, N.S. Fučkar, A. Germe, E. Hawkins, S. Keeley, T. Koenigk, D.S. y Mélia, and S. Tietsche, 2014: A review on Arctic sea-ice predictability and prediction on seasonal to decadal time-scales. Q.J.R. Meteorol. Soc., 142, 546–561, https://doi.org/10.1002/qj.2401.
Ivanova, N., L.T. Pedersen, R.T. Tonboe, S. Kern, G. Heygster, T. Lavergne, A. Sørensen, R. Saldo, G. Dybkjær, L. Brucker, and M. Shokr, 2015: Inter-comparison and evaluation of sea ice algorithms: towards further identification of challenges and optimal approach using passive microwave observations. The Cryosphere, 9, 1797–1817, https://doi.org/10.5194/tc-9-1797-2015.
Kern, S., T. Lavergne, D. Notz, L.T. Pedersen, R.T. Tonboe, R. Saldo, and A.M. Sørensen, 2019: Satellite passive microwave sea-ice concentration data set intercomparison: closed ice and ship-based observations. The Cryosphere, 13, 3261–3307, https://doi.org/10.5194/tc-13-3261-2019.
Kern, S., A. Rösel, L.T. Pedersen, N. Ivanova, R. Saldo, and R.T. Tonboe, 2016: The impact of melt ponds on summertime microwave brightness temperatures and sea-ice concentrations. The Cryosphere, 10, 2217–2239, https://doi.org/10.5194/tc-10-2217-2016.
Lavergne, T., A. Macdonald Sørensen1, S. Kern, R. Tonboe, D. Notz, S. Aaboe, L. Bell, G. Dybkjær, S. Eastwood, C. Gabarro, G. Heygster, M.A. Killie, M.B. Kreiner, J. Lavelle, R. Saldo, S. Sandven, and L.T. Pedersen, 2019: Version 2 of the EUMETSAT OSI SAF and ESA CCI sea-ice concentration climate data records. The Cryosphere, 13, 49–78, https://doi.org/10.5194/tc-13-49-2019.
Meier, W., F. Fetterer, A. Windnagel, and S. Stewart, 2021: NOAA/NSIDC Climate Data Record of Passive Microwave Sea Ice Concentration, Version 4. https://doi.org/10.7265/EFMZ-2T65.
Meier, W.N., and J. S. Stewart, 2019: Assessing uncertainties in sea ice extent climate indicators. Environ. Res. Lett., 14, 035005, https://doi.org/10.1088/1748-9326/aaf52c.
Meier, W.N., and J. S. Stewart, 2020: Assessment of the Stability of Passive Microwave Brightness Temperatures for NASA Team Sea Ice Concentration Retrievals. Remote Sensing, 12, 2197, https://doi.org/10.3390/rs12142197.
Tivy, A., S.E.L. Howell, B. Alt, S. McCourt, R. Chagnon, G. Crocker, T. Carrieres, and J.J. Yackel, 2011: Trends and variability in summer sea ice cover in the Canadian Arctic based on the Canadian Ice Service Digital Archive, 1960–2008 and 1968–2008. Journal of Geophysical Research, 116,C03007. https://doi.org/10.1029/2009JC005855
Wagner, P.M., N. Hughes, P. Bourbonnais, J. Stroeve, L. Rabenstein, U. Bhatt, J. Little, H. Wiggins, and A. Fleming, 2020: Sea-ice information and forecast needs for industry maritime stakeholders. Polar Geography, 43, 160–187, https://doi.org/10.1080/1088937x.2020.1766592.