Overview
This document focusses on wind data from RDRSv2. RDRSv2 is a precipitation and surface reanalysis developed at the Canadian Centre for Meteorological and Environmental Prediction (CCMEP) of Environment and Climate Change Canada (ECCC). It provides various forecasted meteorological variables obtained with the Regional Deterministic Reforecast System (RDRS) two-way coupled with the Canadian Land Data Assimilation System (CaLDAS) and Precipitation Analysis (CaPA), and initialized and driven by ERA-Interim reanalysis. Results are provided at a spatial resolution of 10 km across North America. Data is currently available for the period of 2000-2017. A new version, named RDRSv2.1, that covers the 1981-2018 period is presently under evaluation and will be released to public in 2022.
Provider's contact information
Data developed by the Canadian Centre for Meteorological and Environmental Prediction (CCMEP) of Environment and Climate Change Canada (ECCC)
Electronic Mail Address of the provider: The Canadian Surface Prediction Archive (caspar.data@uwaterloo.ca)
Licensing
The end-user licence for Environment and Climate Change Canada's data servers specifies the conditions of use of this data.
The Canadian Surface Prediction Archive Terms of Service
Variable name and units:
Several variables related to wind are available as predicted values at hourly time steps for two levels: 10 metres, and/or ~40 metres in elevation.
| Variable | Variable long name | Unit | Level |
|---|---|---|---|
| RDRS_v2_P_UU_10m | U-component of the wind (along the grid X axis) | kts | 10m |
| RDRS_v2_P_VV_10m | V-component of the wind (along the grid Y axis) | kts | 10 m |
| RDRS_v2_P_UUC_10m | U-component of the wind (along West-East direction) | kts | 10 m |
| RDRS_v2_P_VVC_10m | V-component of the wind (along South-North direction) | kts | 10 m |
| RDRS_v2_P_UVC_10m | Wind Modulus (derived using UU and VV) | kts | 10 m |
| RDRS_v2_P_WDC_10m | Meteorological wind direction (derived using UU and VV) | [degree] | 10 m |
| RDRS_v2_P_UU_09944 | U-component of the wind (along the grid X axis) | kts | ~40 m |
| RDRS_v2_P_VV_09944 | V-component of the wind (along the grid Y axis) | kts | ~40 m |
| RDRS_v2_P_UUC_09944 | U-component of the wind (along West-East direction) | kts | ~40 m |
| RDRS_v2_P_VVC_09944 | V-component of the wind (along South-North direction) | kts | ~40 m |
| RDRS_v2_P_UVC_09944 | Wind Modulus (derived using UU and VV) | kts | ~40 m |
| RDRS_v2_P_WDC_09944 | Meteorological wind direction (derived using UU and VV) | [degree] | ~40 m |
Note that RDRS_v2_P_UU, RDRS_v2_P_VV are raw model outputs (along the model grid axes). CaSPAr converted the u- and v-components into wind speed (UVC) and wind direction (WDC) as well as UUC and VVC along the unrotated grid (along West-East and South-North directions).
Information about other variables available for download can be found on CaSPAr data portal.
Spatial coverage and resolution:
The data is available for all of North America at an approximate 10 km x 10 km spatial resolution on a rotated pole grid.
Temporal coverage and resolution:
RDRSv2 is available for the period of 2000-2017 at hourly time steps.
RDRSv2.1, which is presently under evaluation, covers the period of 1981-2018 at hourly time steps.
Information about observations (number, homogeneity)
RDRSv2 is initialized and driven by ERA-Interim reanalysis and rely only on surface observations and no remote sensing observations, such as satellite or radar data. Observations were taken from ECCC's operational and climate data archives and include wind speed. The Integrated Surface Data (ISD, DS463.3) is used in the version v2.1 for the years prior to 2000. Table 3 from Gasset et al. (2021) summarizes the surface observation datasets used in the assimilation processes.
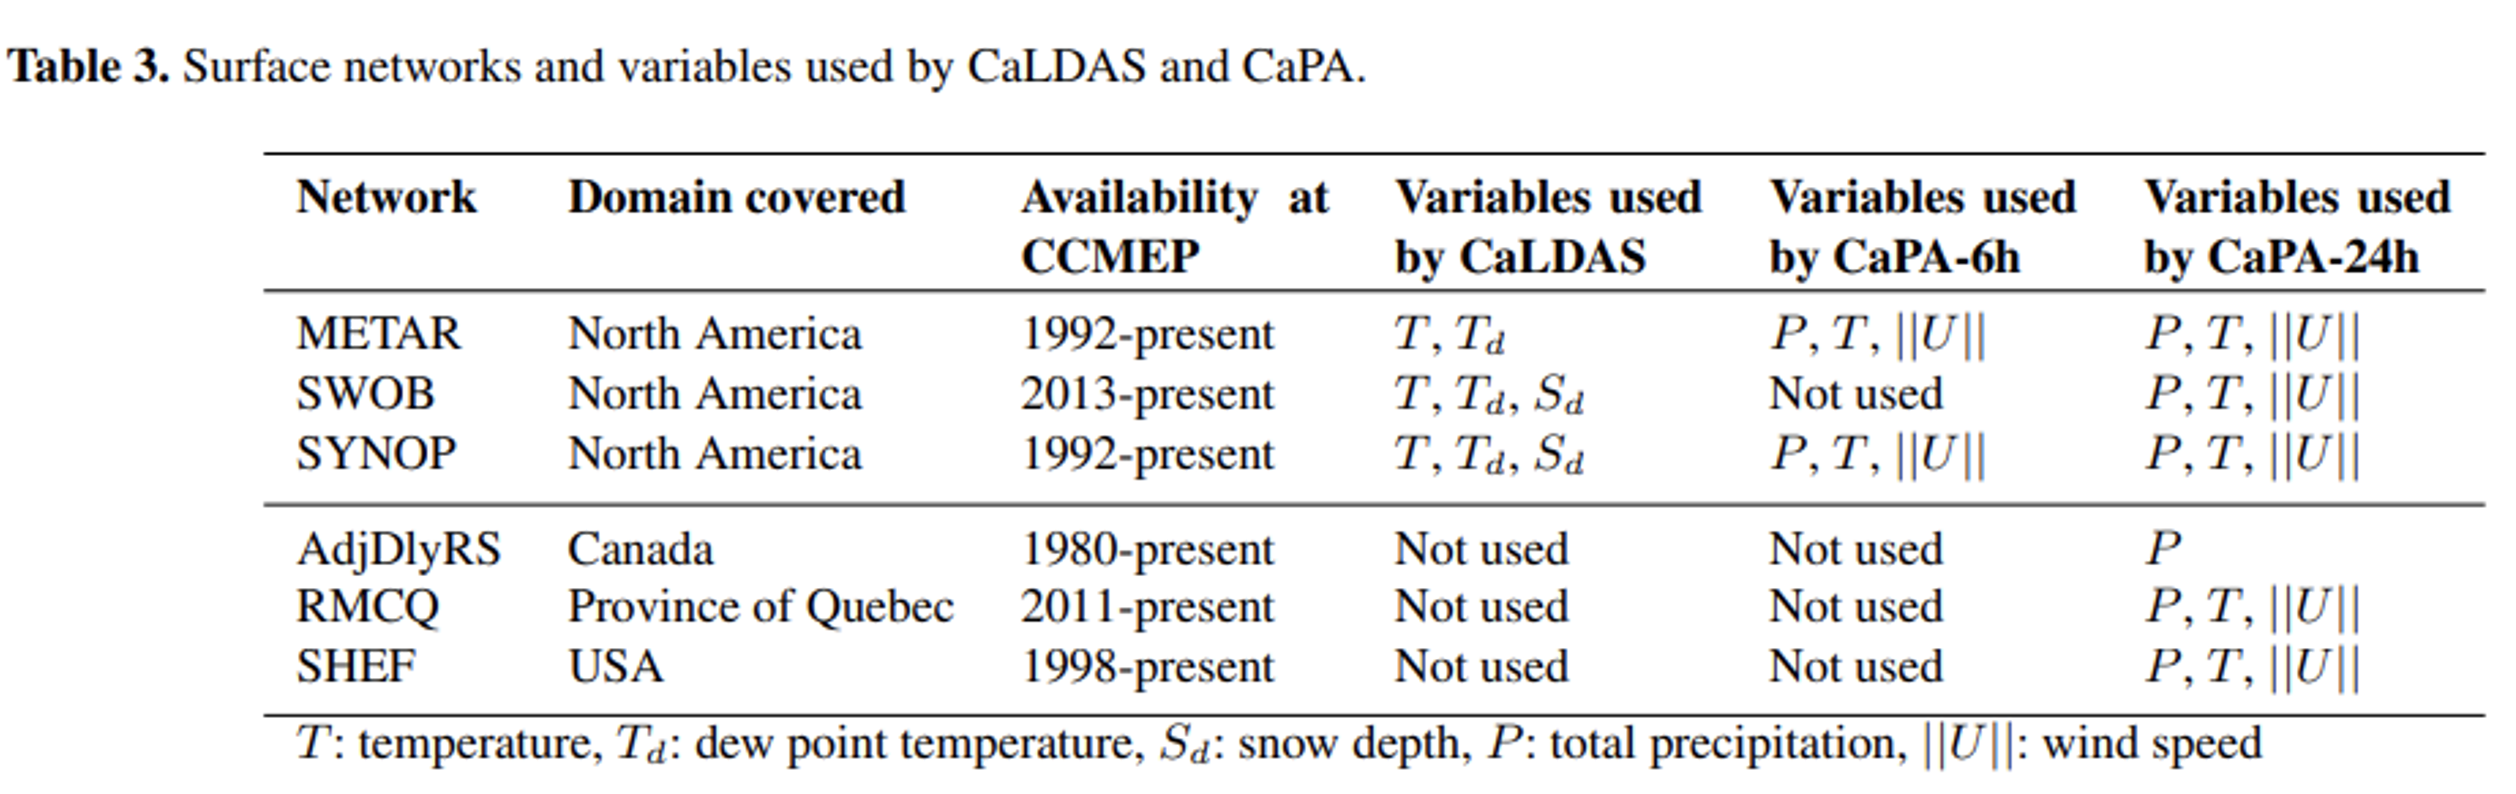
Figure 1 from Lespinas et al. (2010) is presenting the spatial distribution of the meteorological stations assimilated by CaPA and geographical limits of the Canadian terrestrial ecozones.
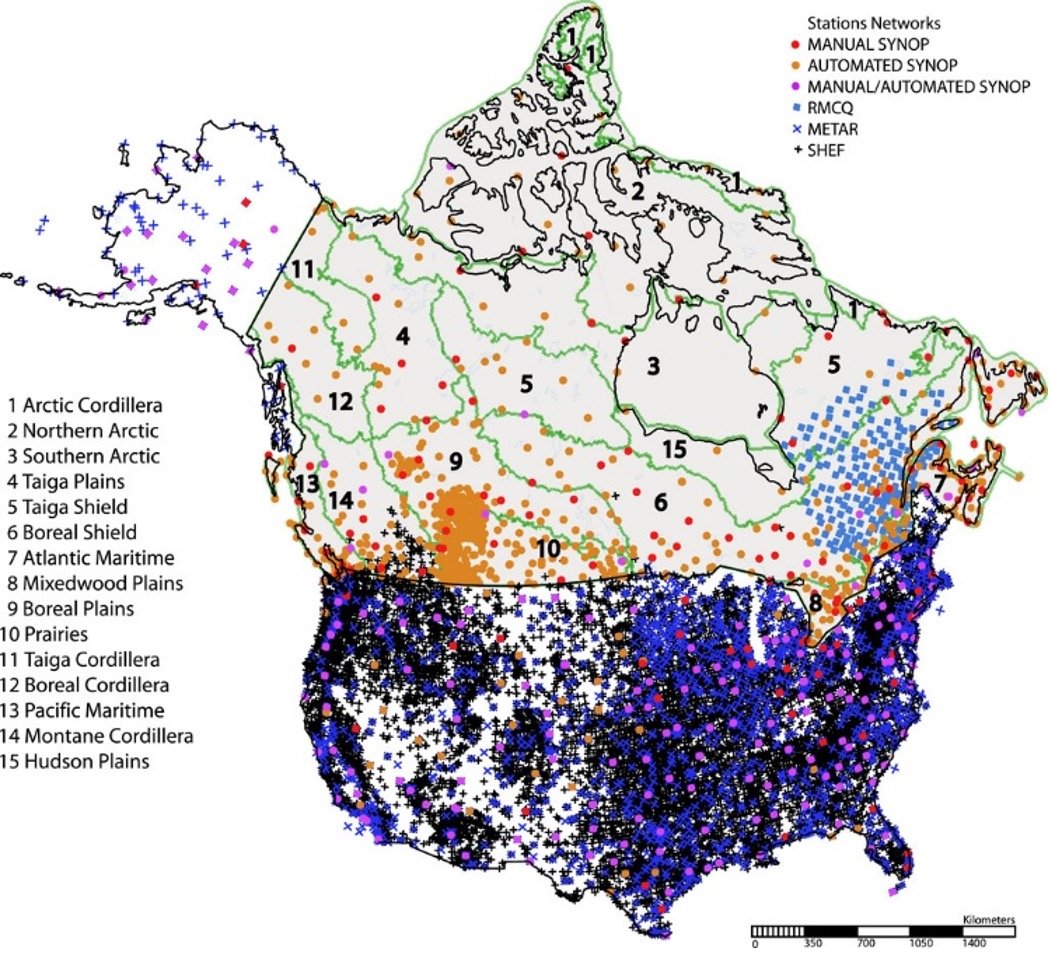
Figure 1. Spatial distribution of the meteorological stations assimilated by CaPA. Source: Journal of Hydrometeorology 16, 5; 10.1175/JHM-D-14-0191.1)
Supplementary information relevant for precipitation, soil moisture and snow: The 24 h a posteriori precipitation analysis, CaPA-24, is also using the Adjusted Daily Rain and Snow (AdjDlyRS) observations dataset (Wang et al., 2017). AdjDlyRS data features 3346 stations that are mainly manual stations from the Canadian synoptic network, and are known as the most reliable observations (they were adjusted for systematic errors, and in particular undercatch and evaporation caused by wind effects, gauge-specific wetting loss, as well as for trace precipitation amounts.).
There is no available information about RDRSv2.1 in this moment.
Methodology
ERA-Interim reanalysis is first used to initialize the atmospheric conditions of the Global Deterministic Reforecast System (GDRS) at a spatial resolution of 39 km. Additional surface conditions are input via the GEM-Surf model, which is also initialized by ERA-Interim. The GDRS output is then dynamically downscaled to 10 km using the RDRS. These finer resolution outputs are two-way coupled with the Canadian Land Data Assimilation System (CaLDAS) and Precipitation Analysis (CaPA) system (this means that outputs from RDRS is used to drive both the CaLDAS and CaPA system, and these results are then fed back into RDRS). This coupling results in significantly improved near-surface atmospheric and land-surface predictions.
Both GDRS and RDRS are based on the latest stable version of the Global Environment Multiscale (GEM v4.8-LTS) model and they are both using the same geophysical fields (i.e. orography, vegetation characteristics, soil thermal and hydraulic coefficients, glaciers fraction) as the corresponding forecast operational versions. The coupling with CaLDAs and CaPA allows for combining surface observations of temperature, humidity, snow depth and precipitation with the first guess provided by the RDRS. CaLDAS uses a one-dimensional Ensemble Kalman Filter (EnKF) to estimate soil moisture and soil temperature, and an optimal interpolation (OI) scheme to estimate snow depth. CaPA combines precipitation observations with a background field obtained from the short-term reforecast provided by the RDRS through an OI method. CaPA also serves to provide CaLDAS with 6-h precipitation analysis.
For more information, please refer to the publication in the references section below.
Information about the technical and scientific quality
Version 2 was evaluated and compared to the operational numerical weather prediction system (RDPS) over the period of 2010-2017. Gasset et al. (2021) mentions that the RDRS improves upon RDPS in most regions and for most variables, notably for Alaska and the Canadian Arctic, as well as Western USA.
In general, reanalyses often do not assimilate any observations of precipitation and of the land-surface state, but instead only provide short-term forecasts of these variables. RDRS do assimilate precipitation observations through the coupling with CaPA. Gasset et al. (2021) mentions that the coupling approach of the GDRS, RDRS, CaLDAS, and CaPA demonstrates significant improvements in the surface layer compared to the results obtained without coupling.
Strict quality control procedures are in place in CaPA to avoid the assimilation of biased observations, and in particular wind-induced undercatch of solid precipitation (based on a temperature analysis, different wind speed thresholds are used depending on the network, the type of gauge and whether the station is manned or automated).
In Gasset et al. (2021), short-term absolute temperature, dew point temperature, and wind speed forecasts from RDRSv2 were compared to observations from synoptic stations across North America. Results indicate that these data may be suitable in driving other environmental models. Likewise, a preliminary streamflow modelling study has also demonstrated that the RDRSv2 has some skill in driving hydrological models to predict runoff into Lake Erie, suggesting that the RDRSv2 may be useful for hydrological purposes.
Internal analyses at ECCC showed that RDRSv2 has good skill in estimating relative humidity in southeast Canada. However, no analysis was performed for northern Canada.
Data is available in netCDF format on CaSPAr data portal. Two scientific papers accompany the dataset, one detailing CaSPAr and the other detailing the RDRSv2 dataset. It is expected that the data will be updated regularly.
There is no available information about RDRSv2.1 in this moment.
Limitations and strengths for application in North Canada
RDRSv2 is initialized and driven by ERA-Interim, a reanalysis dataset that has been since superseded by ERA5. The pending data for the years 1980-1999 and 2018 will continue to use ERA-Interim, and tests are currently being conducted to determine the suitability and impacts of switching to another dataset. Furthermore, a bug that was identified during the development of the 2000-2017 reanalysis data: snow depth was expressed in metres in the code whereas it is supposed to be expressed in centimetres. It was verified that while biases and other errors for snow depth itself wasn't heavily impacted, snow density and snow water equivalent demonstrated significant differences. As such, these two fields are not distributed for 2000-2017 until later releases.
References to documents describing the methodology or/and the dataset
Gasset, N., V. Fortin, M. Dimitrijevic, M. Carrera, B. Bilodeau, R. Muncaster, É.,Gaborit, G. Roy, N. Pentcheva, M. Bulat, X. Wang, R. Pavlovic, F. Lespinas, and D. Khedhaouiria, 2021: A 10 km North American Precipitation and Land Surface Reanalysis Based on the GEM Atmospheric Model. Hydrology and Earth System Sciences, 25(9), 4917-4945, https://doi.org/10.5194/hess-25-4917-2021
Link to download the data and format of data:
The data can be accessed through the CaSPAr data catalogue as well as directly from their data portal:
Data catalogue: https://github.com/julemai/CaSPAr/wiki/Available-products
Data portal: https://caspar-data.ca/caspar (NetCDF)
Publications including dataset evaluation or comparison with other data
Mai, J., B.A. Tolson, H. Shen, É. Gaborit, V. Fortin, N. Gasset, H. Awoye, T. A. Stadnyk, L. M. Fry, E. A. Bradley, F. Seglenieks, A. G. T. Temgoua, D. G. Princz, S. Gharari, A. Haghnegahdar, M. E. Elshamy, S. Razavi, M. Gauch, J. Lin, X. Ni, Y. Yuan, M. McLeod, N. B. Basu, R. Kumar, O. Rakovec, L. Samaniego, S. Attinger, N. K. Shrestha, P. Daggupati, T. Roy, S. Wi, T. Hunter, J. R. Craig, and A. Pietroniro, 2021: Great Lakes Runoff Intercomparison Project Phase 3: Lake Erie (GRIP-E), Journal of Hydrologic Engineering, 26(9), 05021020-1-19. https://doi.org/10.1061/(ASCE)HE.1943-5584.0002097
Reference for CaPA:
Mahfouf, J.-F., B. Brasnett, and S. Gagnon, 2007: A Canadian precipitation analysis (CaPA) project: Description and preliminary results, Atmosphere-Ocean, 45(1), 1-17, DOI: 10.3137/ao.v450101.
Fortin, V., G. Roy, T. Stadnyk, K. Koenig, N. Gasset, and A. Mahidjiba, 2018: Ten Years of Science Based on the Canadian Precipitation Analysis: A CaPA System Overview and Literature Review, Atmosphere-Ocean, 56(3), 178-196, DOI: 10.1080/07055900.2018.1474728.
Lespinas, F., V. Fortin, G. Roy, P. Rasmussen, and T. Stadnyk, 2015: Performance Evaluation of the Canadian Precipitation Analysis (CaPA), Journal of Hydrometeorology, 16(5), 2045-2064. Retrieved May 26, 2021, from
https://journals.ametsoc.org/view/journals/hydr/16/5/jhm-d-14-0191_1.xml