Overview
This document provides an overview of the 2 m humidity data from JRA-55. JRA-55 is a third-generation reanalysis developed by Japanese Meteorological Agency (JMA). It spans the 1958 to present period and represents an update of the previous Japanese 25-year Reanalysis (JRA-25). The analysis period starts in 1958, when regular radiosonde observation began on a global basis. Many of the deficiencies of JRA-25 are alleviated in JRA-55 because the Data Assimilation (DA) system used for the project featured a variety of improvements.
Provider's contact information
JRA-55 is developed by the Japanese Meteorological Agency (JMA). Contact JMA at the email address below with any questions on JRA-55:
Climate Prediction Division, Global Environment and Marine Department,
Japan Meteorological Agency,
Email: jra@met.kishou.go.jp
Contact DIAS Office at the email address below with any questions on JRA-55 stored at DIAS:
DIAS Office
Japan Agency for Marine-Earth Science and Technology
Email: dias-office@diasjp.net
Licensing and citation
The intellectual property rights of the datasets belong exclusively to JMA.
JRA-55 data are provided by collaborative organizations that are separate entities from JMA. User registration and agreement to terms and conditions of data service usage are required individually for each organization. Data at NCAR RDA is licensed under a Creative Commons Attribution 4.0 International Licence.
Individual users should provide JMA (jra@met.kishou.go.jp) with a copy of their scientific or technical papers, publications, press releases or other communications regarding these datasets. The source of the products should be duly acknowledged in scientific or technical papers, publications, press releases or other communications regarding the products. This includes information on the provider of data and of the collaborative organizations from where the data was downloaded.
Example for data downloaded from DIAS Office:
" In this study, the Japanese 55-year Reanalysis (JRA-55) provided by the Japan Meteorological Agency (JMA) was utilized. This dataset was also collected and provided under the Data Integration and Analysis System (DIAS), which was developed and operated by a project supported by the Ministry of Education, Culture, Sports, Science and Technology. "
Example for downloaded from NCAR RDA:
Japan Meteorological Agency/Japan. 2013, updated monthly. JRA-55: Japanese 55-year Reanalysis, Daily 3-Hourly and 6-Hourly Data. Research Data Archive at the National Center for Atmospheric Research, Computational and Information Systems Laboratory. https://doi.org/10.5065/D6HH6H41. Accessed† dd mmm yyyy.
†Please fill in the "Accessed" date with the day, month, and year (e.g., - 5 Aug 2011) you last accessed the data from the RDA.
Spatial coverage and resolution:
JRA-55is a global dataset. Data is available at two spatial resolutions: (1) data on pressure levels at 1.25 degree spatial resolution and (2) data on model TL319L60 grid (~55 km) that was processed to a regular latitude-longitude Gaussian grid (320 latitudes by 640 longitudes, nominally 0.5625 degrees) and is available on NCAR RDA.
Variable name and units:
The following table summarizes the humidity variables available at NCAR RDA a regular latitude-longitude Gaussian grid (320 latitudes by 640 longitudes, nominally 0.5625 degree).
| Notation (name) | Units | Dataset product |
|---|---|---|
| 2 m Relative humidity | % | JRA-55 3-Hourly Model Resolution 2-Dimensional Instantaneous Diagnostic Fields (fcst_surf); JRA-55 6-Hourly Model Resolution Surface Analysis Fields (anl_surf) |
| 2 m Specific humidity | Kg kg-1 | JRA-55 3-Hourly Model Resolution 2-Dimensional Instantaneous Diagnostic Fields (fcst_surf); JRA-55 6-Hourly Model Resolution Surface Analysis Fields (anl_surf) |
Temporal coverage and resolution:
JRA-55 covers1958 to the present period. Humidity fields are available as Instantaneous Diagnostic Fields and from the Surface Analysis. The Diagnostic fields are available at 3h time step, while the Analysis Fields are available just at 6h time steps.
Monthly statistics are computed as averages and variances for the whole month using only six-hourly data for analyzed and instantaneous forecast fields.
The data is updated on a monthly basis.
Information about observations (number, homogeneity)
Most of the observational data employed in JRA-55 are those used in JRA-25. Additionally, newly reprocessed METEOSAT and GMS data were supplied by EUMETSAT and MSC/JMA respectively. The table below summarizes the conventional data assimilate in JRA-55. From 1958 to 2002, JRA-55 is using the same conventional data as ECMWF ERA-40 reanalysis.
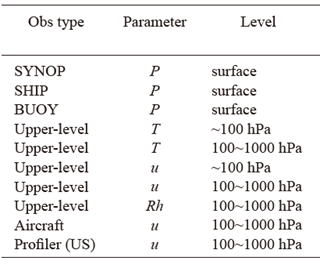
Table 1. Conventional data assimilated in JRA-55
Quality control of conventional data is basically the same as the one used for JRA-25, and it includes a climatological check, track check, removal of duplicates, consistency check and gross error check.
For satellite radiances, tropospheric temperature, and humidity channels are only used in clear sky conditions and channels sensitive to the ground are excluded over land and sea ice because surface temperature and emissivity estimates over those regions are not very reliable.
The analysis of screen-level variables (2 m temperatures, 2 m relative humidities, and 10 m winds) is performed separately from the atmospheric analysis component. These variables are analyzed with a univariate 2-dimensional optimal interpolation (2D-OI).
Methodology
JRA-55 has been produced with the TL319 version of the Japan Meteorological Agency (JMA) operational data assimilation system (as of December 2009), which features numerous improvements made since the Japanese 25-year Reanalysis (JRA-25). These include a revised longwave radiation scheme, 4D-Var and variational bias correction for satellite radiances. It also incorporates several newly available observational datasets produced as a result of ongoing efforts to improve quality of past observations, including homogenization of radiosonde temperature observations (Haimberger et al. 2008, 2012) and reprocessing of satellite data at major meteorological satellite centers.
The analysis of screen-level variables (2 m temperatures, 2 m relative humidities and 10 m winds) is performed separately with a univariate 2-dimensional optimal interpolation (2D-OI). Land surface analysis fields are generated by driving an offline version of the JMA Simple Biosphere (SiB) model with forcing fields from the atmospheric model. Snow depth analysis fields are generated once a day with 2D-OI using SYNOP snow depth observations. First-guess fields are derived for each grid point using (A) snow depth of the land surface analysis and (B) satellite snow covers. Satellite snow covers are retrieved in the 0.25° × 0.25° latitude/longitude grid from microwave imager radiances.
The forecast model used for JRA-55 is based on the TL319 spectral resolution version of the JMA global spectral model (GSM) as of December 2009 (JMA 2007, 2013b), which has been extensively improved since JRA-25.
The reanalysis period was divided into two streams (A002, B002) which have been producing three discontinuities: at 00 UTC on 1 July 1958, 00 UTC on 1 September 1980, and 00 UTC on 1 October 1992. JRA-55 is presently operated on a near-real-time basis and provides monthly updates for the data.
Information about the technical and scientific quality
One important achievement in JRA-55 is the increase in the model resolution (T319L60 vs T106L40 in JRA25). Among the improvements in the product are reduced biases in stratospheric temperature and Amazonian rainfall, and greater temporal consistency of the temperature analysis. Some notable biases persist, including a dry bias in the upper and middle troposphere, and a warm bias in the upper troposphere. The impacts of changes in the observing system on the forecast error are generally more evident in the Southern Hemisphere than the Northern Hemisphere.
The data is updated on a monthly basis. JMA provide a webpage where the issues with jRA-55 are described: JRA-55 Quality Issues
Limitations and strengths for application in North Canada
GENERAL KEY STRENGTHS:
- Longest-running full observing system reanalysis with 4DVar
GENERAL KEY LIMITATIONS:
- Generally, great caution is needed when hydrological variables from reanalyses are used, especially for model diagnostic variables such as precipitation and evaporation. (From NCAR climate Data Guide: ‘’ Due to the practice of observational correction for forecasts (also known as analysis increment), the energy balance is not exactly preserved in reanalysis. The introduction of analysis increment also creates an artificial sink or source in the water budget, which in turn leads to spin up issues (in which precipitation is insufficient immediately after the start of forecasts and then gradually increases) or spin-down issues (the reverse) with the hydrological cycle. (Bosilovich et al., 2011; Trenberth et al., 2011).’’
- Dry bias in upper and middle troposphere and in regions of deep convection
- The impact of changes in observing systems is particularly apparent for July 2006, when Global Navigation Satellite System-Radio Occultation (GNSS-RO) refractivity data were introduced into JRA-55.
References to documents describing the methodology or/and the dataset
Kobayashi, S., Y. Ota, Y. Harada, A. Ebita, M. Moriya, H. Onoda, K. Onogi, H. Kamahori, C. Kobayashi, H. Endo, K. Miyaoka, and K. Takahashi, 2015: The JRA-55 Reanalysis: General specifications and basic characteristics. Journal of the Meteorological Society of Japan. Ser. II, 93(1), 5-48, doi:10.2151/jmsj.2015-001.
Harada, Y., H. Kamahori, C. Kobayashi, H. Endo, S. Kobayashi, Y. Ota, H. Onoda, K. Onogi, K. Miyaoka, and K. Takahashi, 2016: The JRA-55 Reanalysis: Representation of atmospheric circulation and climate variability, J. Meteor. Soc. Japan, 94, 269-302, doi:10.2151/jmsj.2016-015.
Link to download the data and format of data:
The JRA-55 data are available in GRIB-2 format and can be accessed from the following organizations:
DIAS: Data Integration & Analysis System (data from 1958 to 2012, on a grid of approx. 1.25 deg.) : http://search.diasjp.net/en/dataset/JRA55
NCAR: National Center for Atmospheric Research (USA) (data from 1958 to present, on both spatial grids):
- Daily, 3-Hourly and 6-Hourly Data http://rda.ucar.edu/datasets/ds628.0/
- Monthly Means and Variances http://rda.ucar.edu/datasets/ds628.1/
- Near Real-Time Data http://rda.ucar.edu/datasets/ds628.8/
- Near Real-Time Data -- Monthly Means and Variances http://rda.ucar.edu/datasets/ds628.9/