Overview
WorldClim Version 2 is a dataset of spatially interpolated monthly climate data for global land areas at a very high spatial resolution (approximately 1 km2). Precipitation data was aggregated across a target temporal range of 1970–2000. Weather station data was interpolated using thin-plate splines with covariates which include elevation (from SRTM), distance to the coast and three satellite-derived covariates: maximum and minimum land surface temperature and cloud cover, obtained from the MODIS satellite platform. Interpolation was done for 23 regions of varying size depending on station density. The dataset also includes monthly temperature (minimum, maximum and average), solar radiation, vapour pressure and wind speed.
Provider's contact information
This spatial dataset was developed by Stephen E. Fick and Robert J. Hijmans at the University of California.
Licensing
Freely available.
WorldClim by worldclim.org is licensed under a Creative Commons Attribution-NonCommercial-ShareAlike 4.0 International Licence.
Variable name and units:
Total precipitation (mm)
Spatial coverage and resolution:
The dataset is made available in four different resolutions: 30 arc seconds (~1 km2), 2.5 arc minutes (~85km2), 5 arc minutes (~170km2)and 10 arc minutes (~340 km2)
Temporal coverage and resolution:
Monthly values for the period 1970-2000.
Information about observations (number, homogeneity)
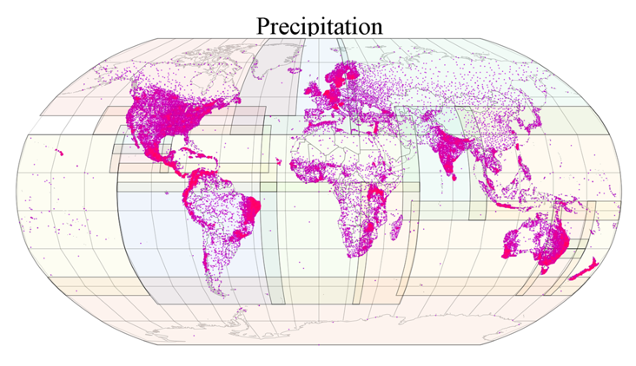
Data from between 9000 and 60 000 weather stations were collected from multiple sources at daily and monthly resolution and was interpolated using thin-plate splines with covariates, including elevation, distance to the coast. (No covariates from satellites were used for precipitation). The interpolation was done separately for 23 regions, selecting the best performing model for each region and variable. Observations station metadata were checked to match the stations' elevation with the elevation information used in the production.
Methodology
The dataset was generated using ANUSPLIN (Hutchinson & Xu, 2013) for monthly precipitation (and other variables). Daily values were aggregated to monthly values. Duplicates from the multiple sources of station data used were removed as much as possible, giving preference to the stations with the most stringent error-checking procedures. Surface fitting was done for stations with observations for at least 25 years. Stations with shorter periods of data availability were used if they were located at a minimum distance of 25 km (for precipitation) from all stations selected in the first pass. For precipitation 34 542 stations were used, with 13 763 meeting the 25 years of data availability between 1970 and 2000 criterion.
Data for Canada were produced over a relatively large region covering Canada and parts of the US.

Figure 1: Precipitation stations and regions used for the interpolation of precipitation (from Fick and Hijmans, 2017)
Information about the technical and scientific quality
In the evaluation by Fick and Hijmans (2017), accuracy for precipitation (𝜌=0.86) was the second lowest (after wind speed 𝜌=0.76). The authors state that relatively low performance for precipitation is similar to what was reported for previously published climate surfaces and relates to the fact that precipitation can be highly variable in time and space and some regions have abrupt changes (rain shadows). Such very strong gradients tend to come out too smooth in the climate surfaces.
Limitations and strengths for application in North Canada
Although a global dataset it can be considered interpolated for Canada since a separate region covering Canada was used for the production.
The dataset also contains 19 derived bioclimatic variables: annual mean temperature, mean diurnal range, isothermality, temperature seasonality, max. temperature of the warmest month, min. temperature of the coldest month, temperature annual range, mean temperature of the wettest quarter, mean temperature of the driest quarter, mean temperature of the warmest quarter, mean temperature of coldest quarter, annual precipitation, precipitation of the wettest month, precipitation of the driest month, precipitation seasonality (coefficient of variation), precipitation of wettest quarter, precipitation of driest quarter, precipitation of warmest quarter, precipitation of the coldest quarter.
References to documents describing the methodology or/and the dataset
Fick, S.E. and R.J. Hijmans, 2017: WorldClim 2: new 1 km spatial resolution climate surfaces for global land areas. Int. J. Climatol, 37, 4302-4315. https://doi.org/10.1002/joc.5086
Link to download the data and format of data:
Data is available as “zip” files containing 12 GeoTiff (.tif) files, one for each month of the year (January is 1; December is 12) at https://worldclim.org/data/worldclim21.html
Publications including dataset evaluation or comparison with other data in northern Canada
Noce, S., L. Caporaso, and M. Santini, 2020: A new global dataset of bioclimatic indicators. Sci Data 7, 398, https://doi.org/10.1038/s41597-020-00726-5