Overview
This document focusses on precipitation related data from NARR. NARR is a regional reanalysis covering the North America using a Northern Lambert Conformal Conic grid with an approximately 0.3 degrees (32 km) spatial resolution at the lowest latitude. Dataset was originally produced at NOAA's National Center for Atmospheric Prediction (NCEP), and detailed description is provided at https://psl.noaa.gov/data/gridded/data.narr.html#detail with online Analysis and Plotting Tools at https://psl.noaa.gov/cgi-bin/data/getpage.pl.
Provider's contact information
Physical Sciences Laboratory: Data Management
NOAA/ESRL/PSL
325 Broadway
Boulder, CO 80305-3328
psl.data@noaa.gov.
Licensing
This work is licensed under a Creative Commons Attribution 4.0 International Licence.
There are no restrictions for the use of data.
If the data are taken from PSD, the providers ask that the data is acknowledged by including text such as NCEP Reanalysis data provided by the NOAA/OAR/ESRL PSD, Boulder, Colorado, USA, from their Web site at http://www.esrl.noaa.gov/psd/ in any documents or publications using these data.
If the data are taken from NCAR, the citation should include the following: National Centers for Environmental Prediction/National Weather Service/NOAA/U.S. Department of Commerce. 2005, updated monthly. NCEP North American Regional Reanalysis (NARR). Research Data Archive at the National Center for Atmospheric Research, Computational and Information Systems Laboratory. https://rda.ucar.edu/datasets/ds608.0/. Accessed dd mmm yyyy.
Variable name and units:
The variables are divided into three sections: Pressure level, Monolevel (surface and others) and Subsurface. Precipitation rate data are available in the list of Monolevel variables and they are the output of the analysis and first guess forecast.
Precipitation rate [kg/m^2/s] with
* Categorical snow [yes=1;no=0]
* Categorical ice pellets [yes=1;no=0]
* Categorical freezing rain [yes=1;no=0]
* Categorical rain [yes=1;no=0]
Some variables are available just from the first guess forecast:
Accumulated total precipitation [kg/m^2]
Accumulated convective precipitation [kg/m^2]
Table with snow variables available in NetCDF format at NOAA
| Variable | Statistic | Level | Download File |
|---|---|---|---|
| Accumulated total precipitation | 3-hourly Accumulation | Surface | apcp.yyyy.nc |
| Accumulated total precipitation | Daily Accumulation | Surface | apcp.yyyy.nc |
| Accumulated total precipitation | Monthly average of Daily Accumulation | Surface | apcp.mon.mean.nc |
| Accumulated total precipitation | Longterm Monthly Mean of daily totals | Surface | apcp.mon.ltm.nc |
| Accumulated convective precipitation | 3-hourly Accumulation | Surface | acpcp.yyyy.nc |
| Accumulated convective precipitation | Daily Accumulation | Surface | acpcp.yyyy.nc |
| Accumulated convective precipitation | Monthly Mean of Daily Accumulation | Surface | acpcp.mon.mean.nc |
| Accumulated convective precipitation | Longterm Monthly Mean of Daily Accumulation | Surface | acpcp.mon.ltm.nc |
| Precipitation rate | 3-hourly values | Surface | prate.yyyy.nc |
| Precipitation rate | Daily Mean | Surface | prate.yyyy.nc |
| Precipitation rate | Long-term Daily Mean | Surface | prate.day.ltm.nc |
| Precipitation rate | Monthly Mean | Surface | prate.mon.mean.nc |
Values labelled 3 hourly values are output at that exact time (no averaging).
Values labelled accumulations are 3 hours later.
Values labelled 3 hourly averages are averaged over 0 to 3 hr later.
For a complete list of model output variables, see NCEP's variable list. Details for Monolevel variables are provided on https://psl.noaa.gov/data/gridded/data.narr.monolevel.html .
Spatial coverage and resolution:
The data is available for all of North America at an approximate 0.3 degrees (32 km) spatial resolution at the lowest latitude, on a Northern Lambert Conformal Conic grid. Corners of this grid are 1.000001 N, 145.5 W; 0.897945 N, 68.32005 W; 46.3544 N, 2.569891 W; 46.63433 N, 148.6418E. A page describing the coverage along with information on reading the projection is available.
Temporal coverage and resolution:
Data is available as 3h values, Daily and Monthly means for the period 1979/01/01 to 2021/05/31.
Information about observations
The data that are assimilated in order to initialize the model are temperatures, winds, and moisture from radiosondes as well as pressure data from surface observations. Also included in this dataset are dropsondes, pibals, aircraft temperatures and winds, satellite radiance (a measure of heat) from polar (orbiting Earth) satellites, and cloud-drift winds from geostationary (fixed at one location viewing Earth) satellites. The sources of observations are summarized in the table below.
| Dataset | Details | Source |
|---|---|---|
| Precipitation | Continental United States: comes from a 1/8-degree gauge dataset analyzed using PRISM and a least-squares distance-weighting algorithm. Canada and Mexico: comes from 1-degree gauge datasets and is disaggregated using NCEP R2 hourly precipitation weighting factors. Over oceans (<42.5°N): comes from the Climate Prediction Center (CPC) CMAP (CPC Merged Analysis of Precipitation), a merged combination of satellite and gauge precipitation. It is using a 15-degree “blending belt” between 27.5 and 42.5 N, with no CMAP north of 42.5 N. | NCEP/CPC,Canada, Mexico |
| TOVS-1B radiances | Temperature, precipitable water over ocean | NESDIS |
| NCEP Surface | Wind, moisture | GR |
| TDL Surface | Pressure, wind, moisture | NCAR |
| COADS (ships/buoys) | Pressure, wind, moisture | NCEP/EMC |
| Air Force Snow | Snow depth (The Air Force Weather Agency snow depth is estimated daily by merging satellite-derived snow cover data with daily snow depth reports from ground stations.) | COLA and NCEP/EMC |
| SST | 1-degree Reynolds, with Great Lakes SSTs | NCEP/EMC, GLERL |
| Sea and lake ice | Contains data on Canadian lakes, Great Lakes | NCEP/EMC, GLERL, |
| Ice Services Canada | ||
| Tropical cyclones | Locations used for blocking of CMAP Precipitation Lawrence | Livermore National Laboratory |
The following figure presents sample distributions of surface assimilated data.
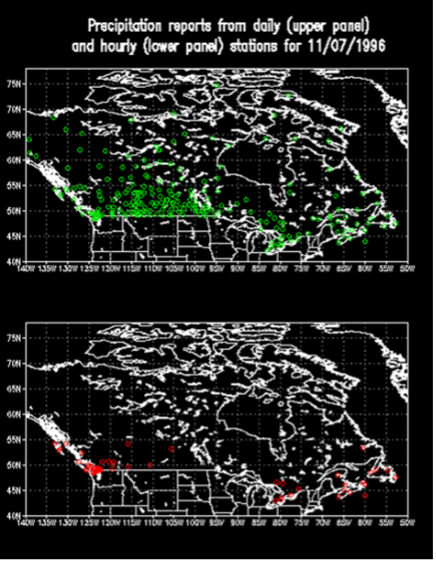
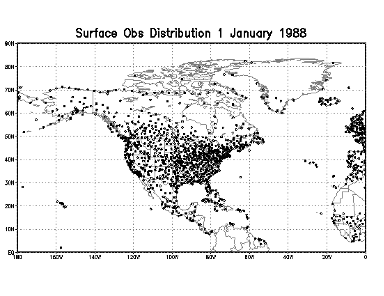
Figure 1. a) Sample distribution of Canadian precipitation assimilated data; b) Sample distribution of surface observations
Methodology
The NARR project is an extension of the NCEP Global Reanalysis which is run over the North American Region. The NARR model uses a high-resolution NCEP Eta Model (32 km/45 layer) together with the Regional Data Assimilation System (RDAS) using 3DVAR method, and it is one of the few reanalysis that assimilates precipitation along with other variables, also over Canada this feature is much reduced comparable to the US. It is using the ETA / NOAH land surface model and it is assimilating snow depths from US Air Force daily snow depth analysis.
For more information, please refer to the publication in the references section below.
Information about the technical and scientific quality
The improvements in the model/assimilation have resulted in a dataset with substantial improvements in the overall accuracy of temperature, winds and precipitation compared to the NCEP-DOE Global Reanalysis 2 (the parent global reanalysis). Wind improvement is especially greatest in the upper troposphere in winter. The 10 m winds improved greatly in winter, a little bit in summer. Relative humidity also improved in both analysis and first guess forecast.
The analyzed precipitation used for precipitation assimilation comes from four sources. Over the continental United States, the analysis comes from a gage dataset and is analyzed onto a 1/8-degree grid using the PRISM mountain mapper and a least-squares distance weighting scheme. Over Mexico and Canada, the analysis comes from gage datasets analyzed onto 1-degree grids. Neither of those datasets has PRISM or a least-squares weighting scheme. Over the rest of the domain, the CMAP dataset is used. CMAP is a combination of gage and satellites, analyzed onto a 1-degree grid. Despite an attempt at a smooth blending, we still see discontinuities between the different datasets, especially around coastlines and borders of countries. It is important to note also that the number of gauge observations available over Canada is insufficient for the precipitation over Canada from reanalysis to do better than the model is doing.
Useful information can be found at NCEP's NARR FAQ page: http://www.emc.ncep.noaa.gov/mmb/rreanl/faq.html.
Data is updated on a monthly base.
Limitations and strengths for application in North Canada
A very small number of surface measurements are assimilated for norther Canada.
References to documents describing the methodology or/and the dataset
Mesinger, F., G. DiMego, E. Kalnay,K. Mitchell, P. C. Shafran, W. Ebisuzaki, D. Jović, J. Woollen, E. Rogers, E. H. Berbery, M. B. Ek, Y. Fan, R. Grumbine, W. Higgins, H. Li, Y. Lin, G. Manikin, D. Parrish, and W. Shi, 2006: North American Regional Reanalysis. Bulletin of the American Meteorological Society, 87(3), 343-360, doi:10.1175/BAMS-87-3-343.
Link to download the data and format of data:
NARR is available through NOAA ftp page, UCAR and from NCDC page.
NOAA: ftp://ftp.cdc.noaa.gov/Datasets/NARR/ (NetCDF standard format; the data are divided by variable and year and month into separate files; Missing data is flagged with a value of 9.96921e+36f.)
NCDC: https://www.ncdc.noaa.gov/data-access/model-data/model-datasets/north-american-regional-reanalysis-narr (GRIB format)
UCAR: https://rda.ucar.edu/datasets/ds608.0/ (GRIB format)
Publications including dataset evaluation or comparison with other data in northern Canada