Overview
This dataset provides Climate Normals at the in-situ surface observations archived by the Meteorological Service of Canada (MSC), which containes data from the MSC operational observation system as well as from their parteners. The Climate Normals summarize or describe the average climatic conditions of a particular location over a period of 30 years, and they are based on Canadian climate stations with at least 15 years of data in the 30-year period. At the completion of each decade, Environment and Climate Change Canada updates its Climate Normals for as many locations and as many climatic characteristics as possible. MSC is QC the Normals but the QC of the data used in the Normal computation is done by the owers of the sites.
Provider's contact information
Environment and Climate Change Canada
donneesclimatiquesenligne-climatedataonline@ec.gc.ca
Licensing
Open Government Licence - Canada.
Variable name and units:
Rainfall (mm)
Snowfall (mm)
Precipitation (mm)
Days with rainfall
>= 0.2 mm
>= 5 mm
>= 10 mm
>= 25 mm
Days with snowfall
>= 0.2 cm
>= 5 cm
>= 10 cm
>= 25 cm
Days with precipitation
>= 0.2 mm
>= 5 mm
>= 10 mm
>= 25 mm
Extreme values and snow on ground (snow depth) are also available.
Spatial coverage and resolution:
Canada, point locations.
Temporal coverage and resolution:
The data is presented as 30-year average and has a decadal time step: 1941-1970, 1951-1980, 1961-1990, 1971-2000 and 1981-2010 periods.
The data will continue to be updated every decade.
Information about observations (number, homogeneity)
The number of active stations changed over time. The following figure from Mekis et al. (2018) is presenting the locations of the surface weather stations across Canada with a Needs Index map in the background as of September 2016.
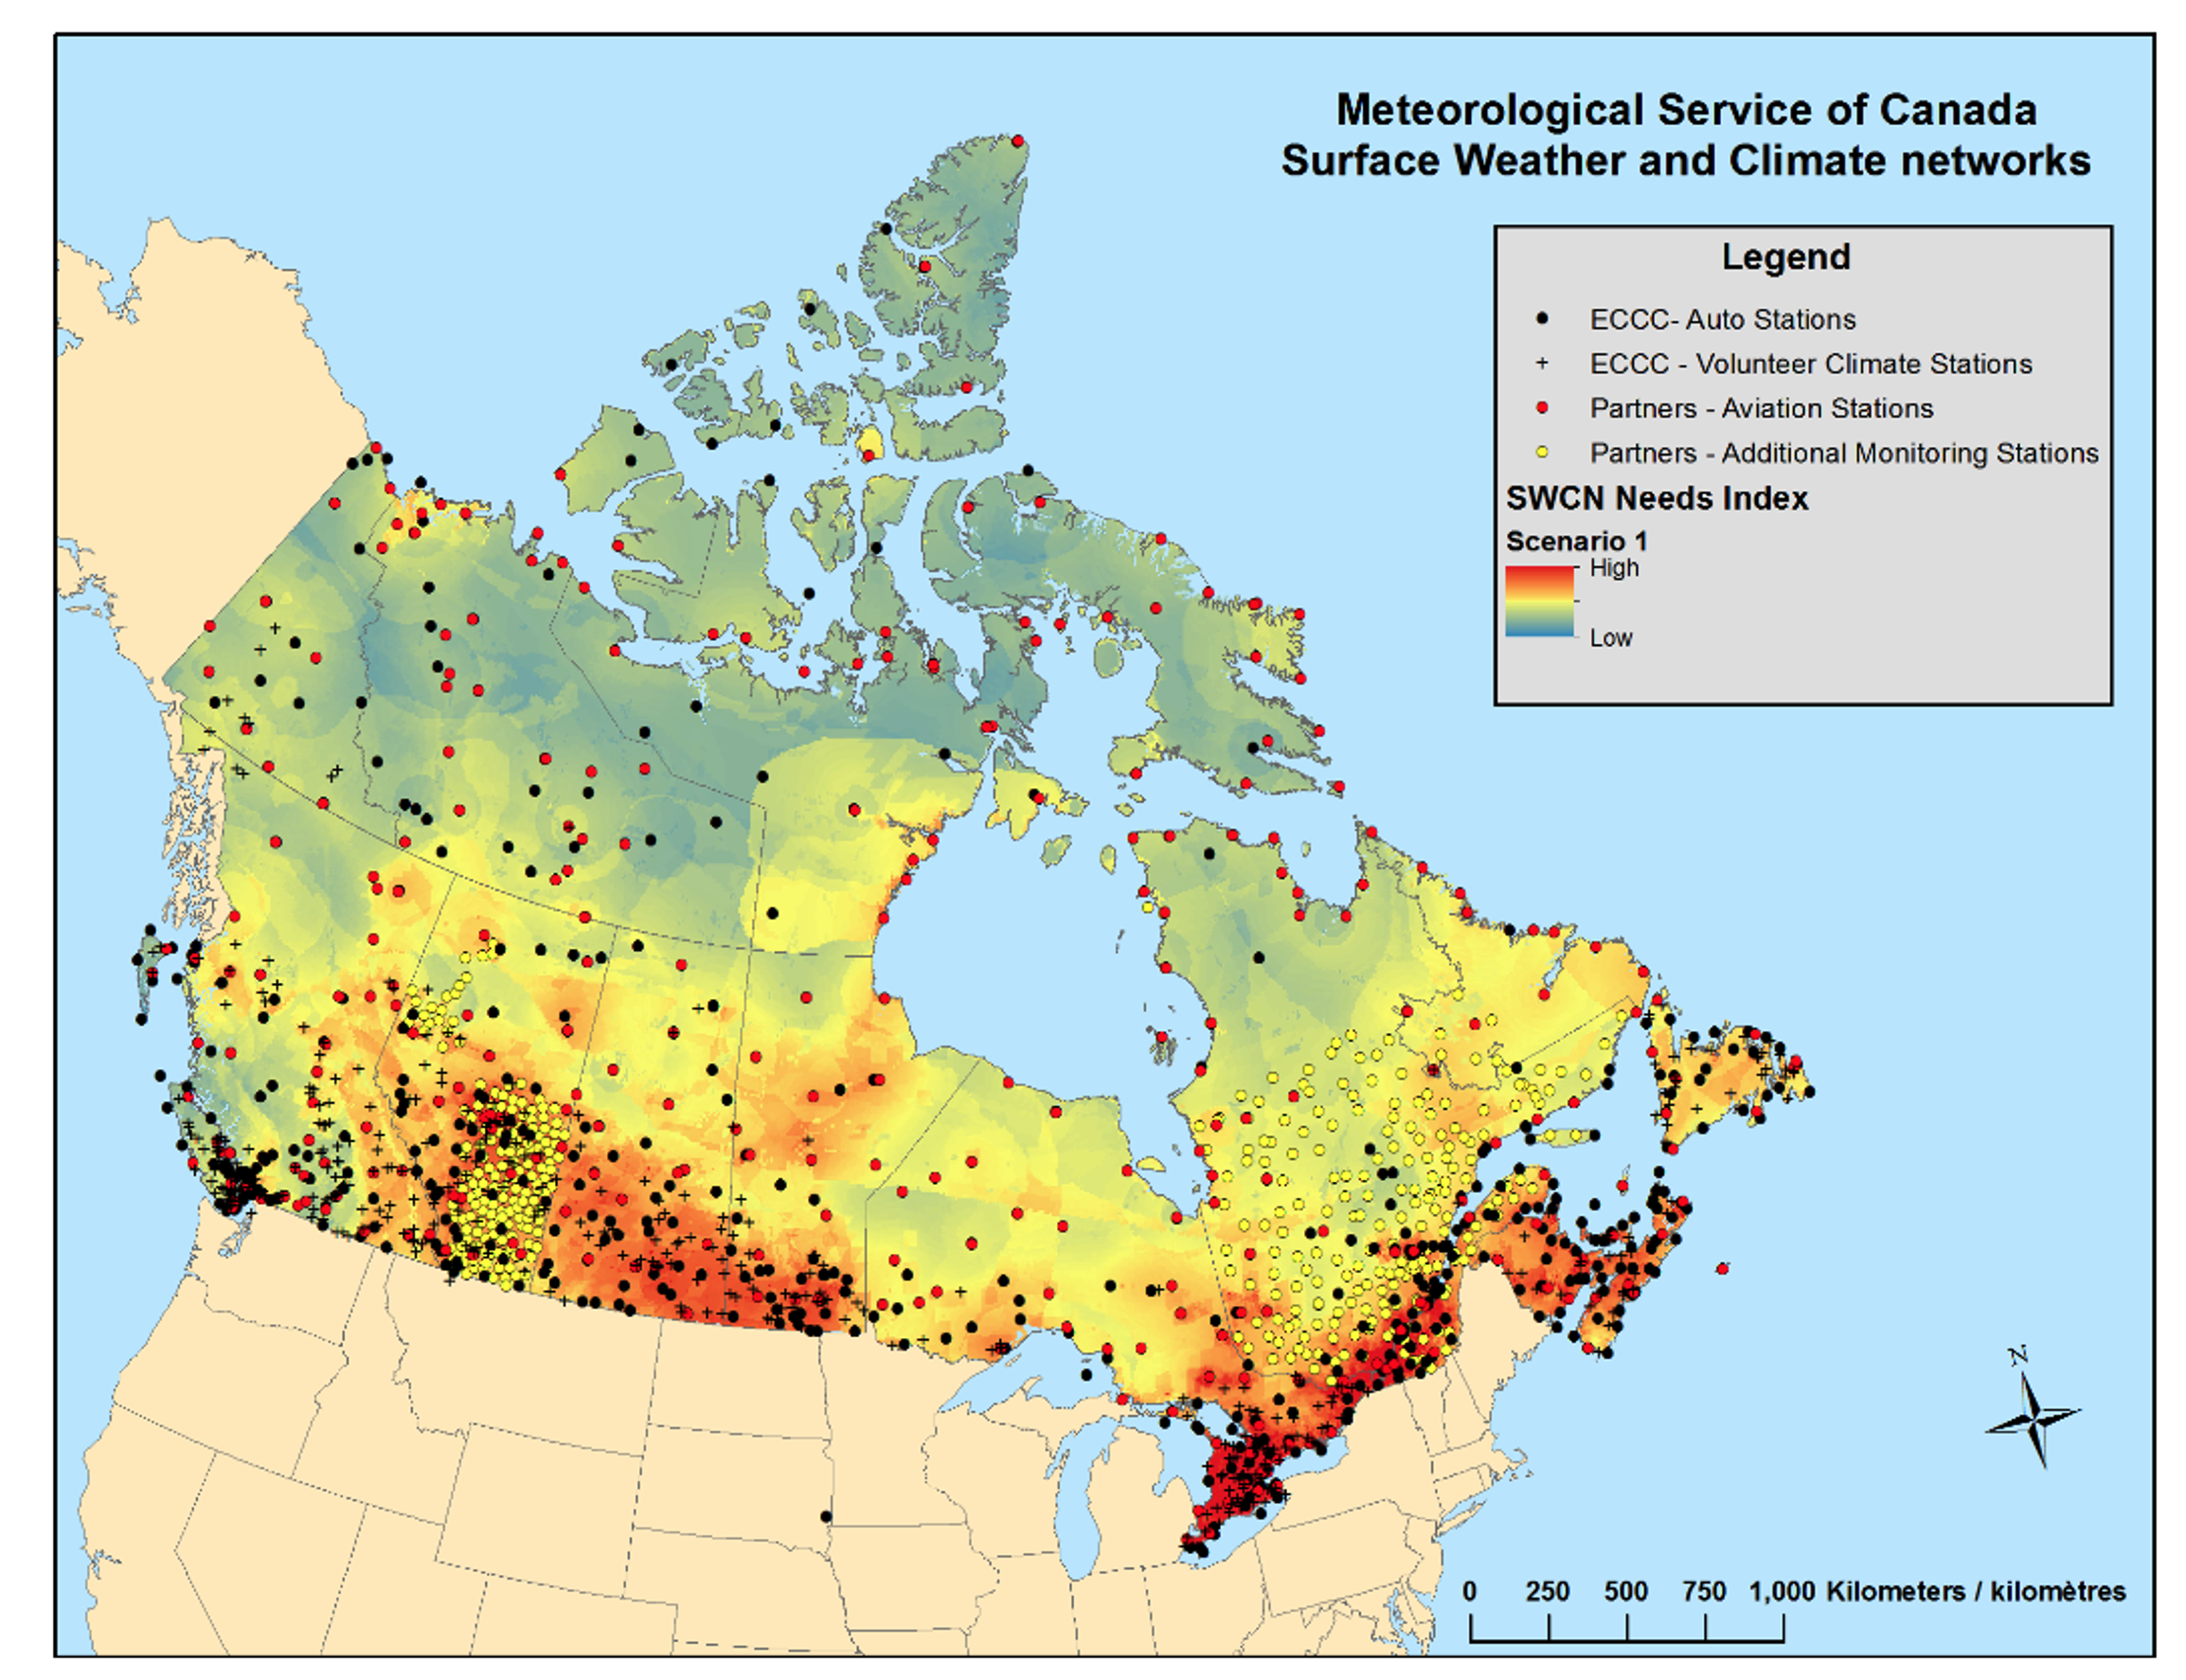
Figure 1. Surface weather stations across Canada, as of September 2016, with a Needs Index map in the background. For further details on station network evolution see Mekis et al. 2018. [Source: Mekis et al., 2018].
Stations over Northern Canda with precipitation measurements are the ECCC atomatic stations, the ECCC Volunteer Climate Stations and stations from the Aviation Monitoring Station network (which include automated and staffed weather stations) operated by NAV CANADA and the Department of National Defence (DND).
The following table presents the number of stations per region in the Northen Canada for the 1981-2010 normals (the number varies with the period of the record).
| Region | No. stations 1981-2010 |
|---|---|
Yukon |
19 (BEAVER CREEK A; BLANCHARD RIVER; BURWASH A; CARCROSS; DAWSON A; DRURY CREEK; FARO A; MAYO A; MAYO ROAD; MCQUESTEN; OLD CROW A; OTTER FALLS NCPC; PELLY RANCH; STEWART CROSSING; TAKHINI RIVER RANCH; TESLIN A; WATSON LAKE A; WHITEHORSE A; WHITEHORSE RIVERDALE) |
NWT |
11 (FORT LIARD A; FORT MCPHERSON A; FORT SIMPSON A; FORT SMITH A; HAY RIVER A; INUVIK A; NORMAN WELLS A; SACHS HARBOUR A; TUKTOYAKTUK A; ULUKHAKTOK A; YELLOWKNIFE A) |
Nunavut |
24 (ALERT; ARVIAT A; BAKER LAKE A; CAMBRIDGE BAY A; CAPE DORSET A; CHESTERFIELD INLET A; CLYDE A; CORAL HARBOUR A; EUREKA A; GJOA HAVEN A; HALL BEACH A; IGLOOLIK; IGLOOLIK A; IQALUIT A; KUGAARUK A; KUGLUKTUK A; LUPIN A; NANISIVIK A; POND INLET A; RANKIN INLET A; REPULSE BAY A; RESOLUTE CARS; TALOYOAK A; WHALE COVE A) |
North Quebec |
3 (LA GRANDE RIVIERE A; KUUJJUARAPIK A; KUUJJUAQ A) |
Labrador |
4 (CARTWRIGHT; GOOSE A; MAKKOVIK A; NAIN A; WABUSH LAKE A) |
Methodology
The MSC computation of normal follows WMO standard procedure, which has evolved with the time. For precipitation, (1) the normal are computed over a 30 year period of consecutive records, starting January 1st and ending December 31st, (2) compute the total the amount for each month (total precipitation, total snowfall), then average (3) do not allow any missing data (use 100% completeness). Annual value is sum of monthly normals from all the individual months in the period of 30 years that sufficiently fulfilled the requirement. The calculation method for the variables that counts the days has changed in new WMO standards:
(a) The count of values for each individual month is calculated, and converted to a percentage of days with available observations. (For example, if there were 25 days with observations in February 1991 and there were 22 days with temperatures ≥ 30 °C, the value for February 1991 is calculated as 88%).
(b) The average percentage count for each month with sufficient available data within the 1991–2020 period is calculated.
(c) This average is then reconverted to an average number of days for the month by multiplying the average percentage by the number of days in the month. February percentages should be multiplied by 28.25.
(d) The sum of the monthly normals as per above instructions constitutes the annual normal.
Information about the technical and scientific quality
This dataset is produced following the standard WMO procedure. MSC is QC the Normals but the QC of the data used in the Normal computation is done by the owers of the sites.
Limitations and strengths for application in North Canada
It is a challenge to sustain a cost-effective observing system over Norther Canada because of a large part of the teritory is constituted by remote areas (need someone to frequently empty the gauges and it is hard for technicians to fly to the site for maintenance in Northern Canada remote locations). The special climatic conditions produce a large risk of power and telecommunication outages. Concequently, observations in Nortehrn Canada are sparse and records are often incomplete. Therefore, apart from any uncertainty due to site, instrument, or observing program changes, or general representativeness of the observing site with the surrounding region, the normals for most locations will have some uncertainty due to the fact that the observations are not complete for the 30-year period.
References to documents describing the methodology or/and the dataset
https://climate.weather.gc.ca/doc/Canadian_Climate_Normals_1981_2010_Calculation_Information.pdf
https://climate.weather.gc.ca/doc/Canadian_Climate_Normals_1971_2000_Calculation_Information.pdf
https://climate.weather.gc.ca/doc/Canadian_Climate_Normals_1961_1990_Calculation_Information.pdf
https://drive.google.com/open?id=1OLqRySaAdJSpajkEGmOAHd7zKR2FW72s
https://drive.google.com/open?id=1M2W8t7bG1JmseLEgm90G8O7hAc718RBD
Link to download the data and format of data:
Most recent Normals (1981-2010):
GeoJSON and CSV on CCCS/ECCC: https://climate-change.canada.ca/climate-data/#/climate-normals
CSV via MSC: https://dd.weather.gc.ca/climate/observations/normals/
CSV via ClimateData.ca: https://climatedata.ca/explore/variable/?var=weather-stations
Note: A smaller number of stations qualify for Normals compared to earlier Normals decadal publications.
For all Normals periods:
CSV via CDO/MSC/ECCC: https://climate.weather.gc.ca/climate_normals/index_e.html
Publications including dataset evaluation or comparison with other data in northern Canada
Information not available.