Overview
This document provides an overview of minimum and maximum temperature gridded datasets created by the Canadian Forest Service, Natural Resources Canada. The dataset covers the period 1950 - 2017 at the daily, pentad and monthly time scale. 30-year averages were also created. The dataset was generated using ANUSPLIN with a 60 arc-second (approximately 2 km) and/or with a 300 arc-second (approximately 10 km) Digital Elevation Model (DEM; Lawrence et al., 2008), using station observations. Station data have been quality controlled but are not homogenized. Daily data is available over Canada, while pentad, monthly, and 30-year time scales are available for continental North America and Canada.
Provider's contact information
This spatial dataset was developed by researchers from the Integrated Ecology and Economics Division at Canadian Forest Service at Natural Resources Canada (Dr. Dan McKenney, Dr. Heather MacDonald, John Pedlar, Kevin Lawrence, Pia Papadopol, Kaitlin de Boer from the CFS and Dr. Michael Hutchinson from Fenner School of Environment and Society, Australian National University). If you have questions about this dataset, please contact Dr. Dan McKenney (dan.mckenney@canada.ca)
Licensing
Freely available. Contact Dr. Dan McKenney, Canadian Forest Service, Natural Resources Canada, dan.mckenney@canada.ca
The following scientific publications should be cited if you use these data in publications:
Canada:
Hutchinson, M.F., D.W. McKenney, K. Lawrence, J.H. Pedlar, R.F. Hopkinson, E. Milewska, and P. Papadopol, 2009: Development and testing of Canada-wide interpolated spatial models of daily minimum–maximum temperature and precipitation for 1961–2003. J. Appl. Meteor. Climatol., 48, 725–741, https://doi.org/10.1175/2008JAMC1979.1.
Hopkinson, R.F., D.W. Mckenney, E.J. Milewska, M.F. Hutchinson, P. Papadopol, and L.A. Vincent, 2011: Impact of aligning climatological day on gridding daily maximum-minimum temperature and precipitation over Canada. Journal of Applied Meteorology and Climatology, 50(8), 1654-1665, doi:10.1175/2011JAMC2684.1
North America:
MacDonald, H., D. W. McKenney, P. Papadopol, K. Lawrence, J. Pedlar, and M.F. Hutchinson, 2020: North American historical monthly spatial climate dataset. 1901–2016. Scientific Data, 7(1), 411-411. https://doi.org/10.1038/s41597-020-00737-2
Variable name and units:
Maximum temperature in degree Celsius (ᵒC);
Minimum temperature in degree Celsius (ᵒC);
Spatial coverage and resolution:
| Daily | Pentad | Monthly | 30-year average | |
|---|---|---|---|---|
| Region | Canada | Canada and North America | Canada and North America | Canada and North America |
| Spatial resolution | ~ 2 km and ~ 10 km | ~ 2 km and ~ 10 km | ~ 2 km and ~ 10 km | ~ 2 km and ~ 10 km |
Temporal coverage and resolution:
Daily – 1950-2017
Pentad – 1950-2017
Monthly – 1950-2017
30-year Average – 1961/1990, 1971/2000, 1981/2010
The data will continue to be updated regularly.
Information about observations (number, homogeneity)
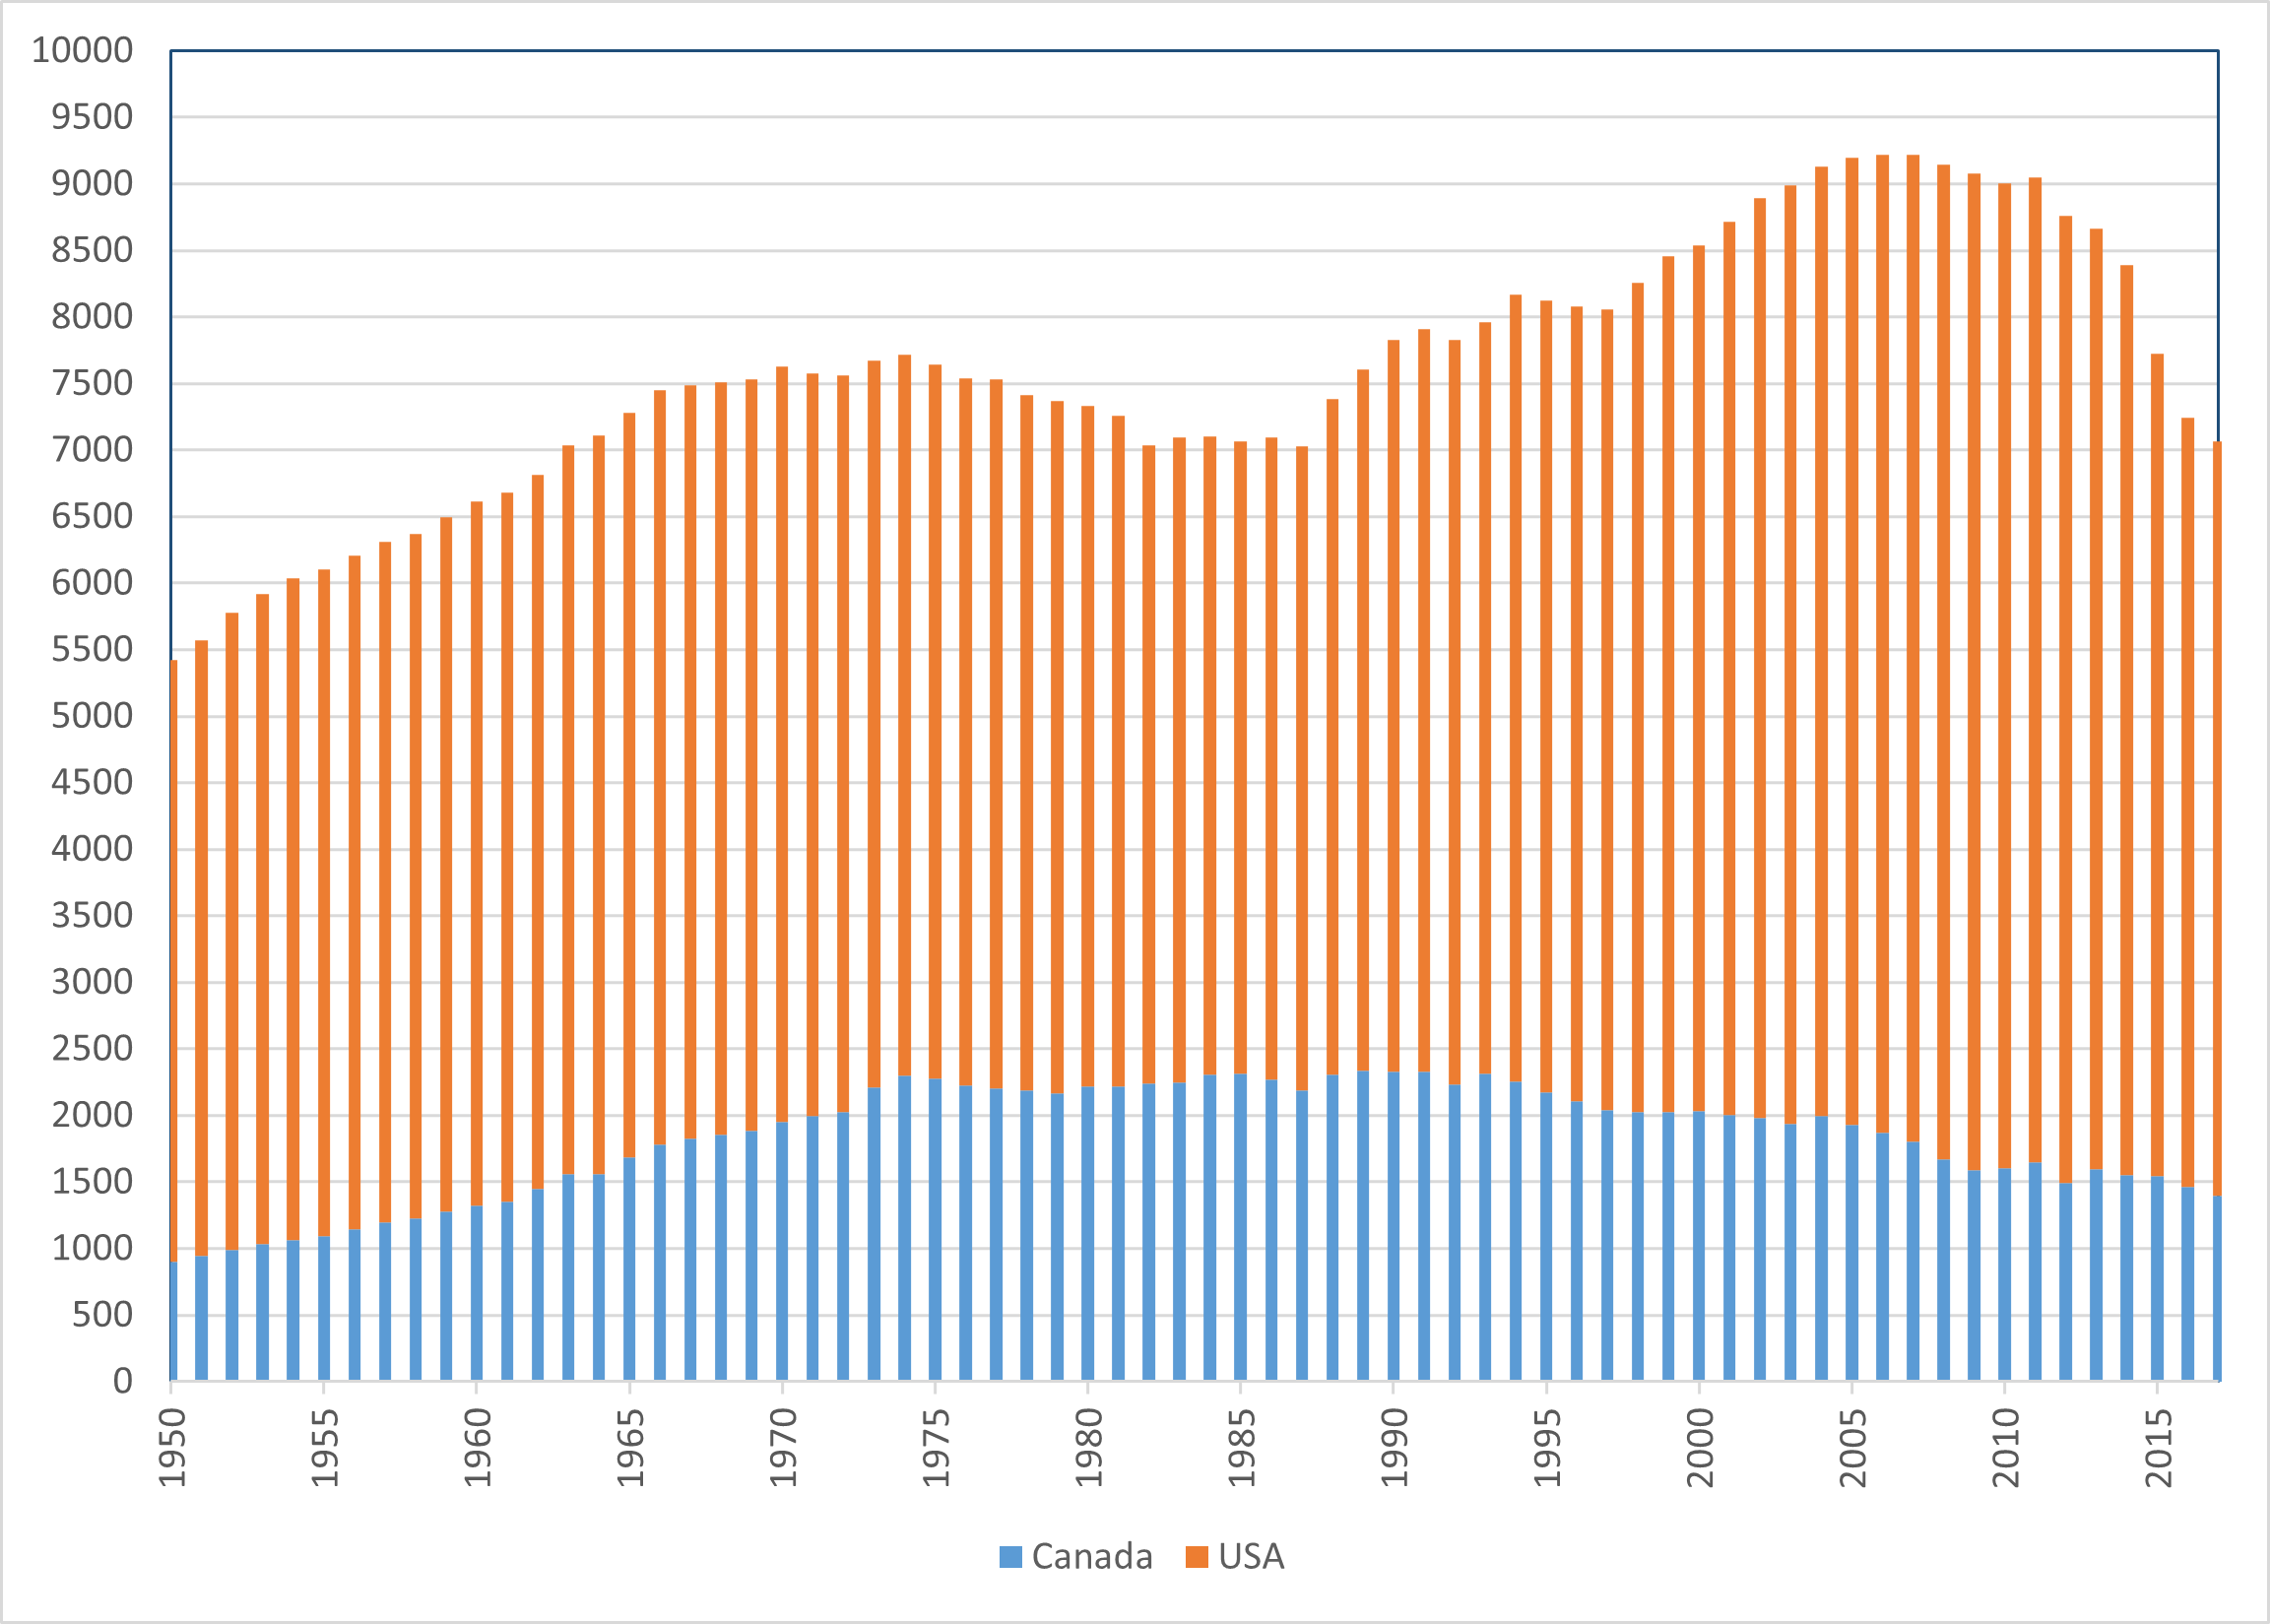
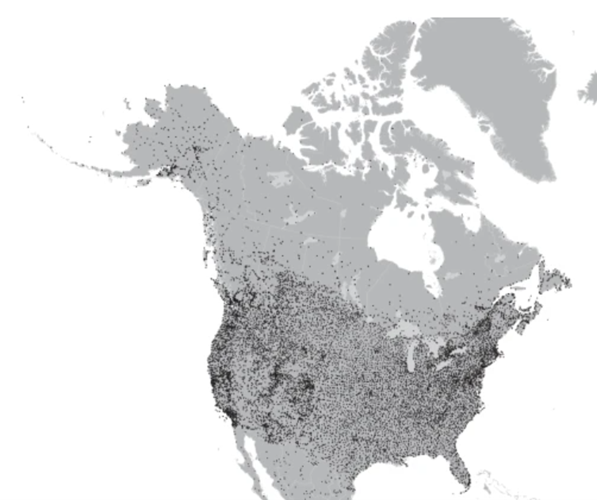
Over Canada, the datasets were generated using station observations from MSC at Environment and Climate Change Canada (ECCC). Station data have been quality controlled for the time of observation but are not homogenized. The number of stations used for spatial modelling increased from 900 in 1950 to 2312 in 1985, and then declined to 1398 stations in 2017 (Figure 1). Stations are not evenly distributed in space. Many stations are located in southern Canada and fewer in northern Canada (Figure 2). For North America datasets, the ECCC stations were supplemented with GHCND hourly weather stations over the USA.

Figure 1. Number of Supporting Observing Stations by Year over Canada and USA (information provided by CFS/NRCan)

Figure 2. Location of stations used in North America ANUSPLIN datasets (from MacDonald et al., 2020). Note: Mexican stations were not covered by the digital elevation model.
Methodology
Daily maximum temperature and daily minimum temperature values over Canada were taken from MSC daily observations. The MSC daily data are derived from two sources depending on if the station has an automatic hourly sensor (most do now):
- hourly (temperatures are reported every hour and then the maximum temperature of the day and minimum temperature of the day are reported as daily max/min values), and
- daily (using a thermometer just for maximum temperature and a thermometer just for minimum temperature that are reported twice a day).
The daily minimum temperatures were adjusted for the change in observing time in 1961 at principal stations (see Hopkinson et al., 2011). Unlike other homogenized datasets (e.g., AHCCD) station joining was not implemented, and instead each record was linked to the exact observation location (see description in MacDonald et al., 2021).
The daily minimum and maximum temperatures over the USA, were estimated from GHCND hourly weather stations.
Spatial models were generated next using thin plate smoothing spline models as implemented in Australian National University Spline (ANUSPLIN; Hutchinson & Xu, 2013) for daily minimum/maximum temperature. For pentad, monthly and 30-year averages, the time average is first computed for each station and the result is next used with ANUSPLIN and the corresponding Digital Elevation Model.
Information about the technical and scientific quality
The data were quality controlled (see Hutchinson et al., 2011) and use up-to-date spatial modelling methods as detailed in MacDonald et al., 2020. The references provide several publications that detail the scientific quality of this data set.
The dataset is accompanied by several scientific papers.
Limitations and strengths for application in North Canada
Hutchinson et al., (2009) provide a comparative assessment of daily temperature spatial model quality in northern Canada.
References to documents describing the methodology or/and the dataset
Lawrence, K.M., M.F. Hutchinson, and D.W. McKenney, 2008: Multi-scale digital elevation models for Canada. Natural Resources Canada, Great Lakes Forestry Centre Frontline Tech. Note 109, 4 pp., https://d1ied5g1xfgpx8.cloudfront.net/pdfs/31499.pdf.
Hopkinson, R.F., D.W. Mckenney, E.J. Milewska, M.F. Hutchinson, P. Papadopol, and L.A. Vincent, 2011: Impact of aligning climatological day on gridding daily maximum–minimum temperature and precipitation over Canada. J. Appl. Meteor. Climatol., 50, 1654–1665, https://doi.org/10.1175/2011JAMC2684.1.
Hutchinson, M.F., and T. Xu, 2013: ANUSPLIN version 4.4 user guide. Australian National University, Fenner School of Environment and Society Doc., 55 pp., https://fennerschool.anu.edu.au/files/anusplin44.pdf.
MacDonald, H., D. W. McKenney, P. Papadopol, K. Lawrence, J. Pedlar, and M.F. Hutchinson, 2020: North American historical monthly spatial climate dataset, 1901–2016. Scientific Data, 7(1), 411-411. https://doi.org/10.1038/s41597-020-00737-2
*MacDonald, H., D.W. McKenney, X.L. Wang, J. Pedlar, P. Papadopol, K. Lawrence, Y. Feng, and M.F. Hutchinson, 2021: Spatial models of adjusted precipitation for Canada at varying time scales. Journal of Applied Meteorology and Climatology, 60(3), 291 304. https://doi.org/10.1175/JAMC-D-20-0041.1
**McKenney, D. W., and et al., 2011: Customized spatial climate models for North America. Bull. Amer. Meteor. Soc., 92, 1611–1622, https://doi.org/10.1175/2011BAMS3132.1.
*Describes spatial models at the pentad time scale (adjusted precipitation only, ANUSPLIN-AdjPdly)
**Describes related spatial models available on an ongoing basis at different time scales
Link to download the data and format of data:
All data is available in asci format at Canadian Forest Service, NRCan (contact Dr. Dan McKenney, dan.mckenney@canada.ca if you are interested in the asci datasets)
Canada-wide daily dataset and North-America wide monthly dataset, both with 300 arc-second spatial resolution in netCDF format, are available at Canadian Center for Climate Services, ECCC (contact the Climate Services Support Desk, https://climate-change.canada.ca/support-desk/Inquiry, if you are interested in this netCDF subset of data)
Publications including dataset evaluation or comparison with other data in northern Canada
Hutchinson, M.F., D.W. McKenney, K. Lawrence, J.H. Pedlar, R.F. Hopkinson, E. Milewska, and P.Papadopol, 2009: Development and testing of Canada-wide interpolated spatial models of daily minimum–maximum temperature and precipitation for 1961–2003. J. Appl. Meteor. Climatol., 48, 725–741, https://doi.org/10.1175/2008JAMC1979.1.